31 December 2020

Link round-up for December 2020

Dave Rubenson explores the differences between a presentation and a journal article. Much of the advice applies to posters, except moreso.

• • • • •
 
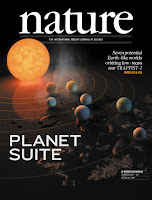
Nature cover showing arti of TRAPPIST-1 exoplanet system
Robert Hurt, an illustrator from Caltech with many Nature covers to his credit, talks about the levels of illusion in scientific illustrations in this interview from The Science Show.

One of the criticisms I've occasionally heard levied about the kind of artwork we do for exoplanets is that they look so real, people might not understand that that's not an actual photo of the planet.... 
But there is this question of if you make the artwork not as compelling, given that you can just walk into the theatre and see three different movies that are all taking you to really awesome looking worlds, do you go ahead and try to match that level of enthusiasm and do something very realistic that pulls people in, with the fear of being too realistic and maybe people walk away with a misconception that we've actually visited these places, versus maybe doing something less compelling but then it maybe won't suck people into the story.

 
There’s another interview with him here.
 
• • • • •

 Looking for a concise summary of your work for your poster title? Try TLDR

Jeffrey Perkel and Richard van Noorden wrote a news feature about this work. The technical paper is available here

It tried the abstract, introduction, and conclusion of one of my papers. The result, alas, didn’t even scan.

Lepidopa benedicti from South Padre Island, Texas, on the western coast of Gulf of Mexico acts as a population sink.

Sigh. A species cannot be a population sink. Clearly a work in progress. But promising!

• • • • •

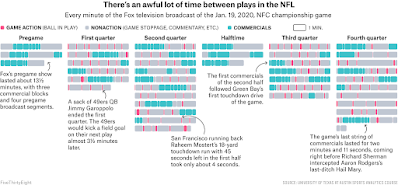
The site’s creator has been talking trash about public health. Not cool, Nate. But he is not the only one creating content on the website, so it’s worth a peak to look at the end of year round-up of Fivethirtyeight’s weirdest and best charts of 2020. I like this one showing how boring gridiron (also known as American football) truly is.

Graph showing every minute of an NFL game

The little red lines are when the ball is in play.

• • • • •

An end of year round-up of data visualizations. This is a lengthy “meta-round-up.” That is, it’s a list of lists. Will take a while to work through these. You were warned. But if you have the time, there are some fine insights in there.

Hat tip to Melissa Vaught

• • • • •

Good bye, 2020! Let’s hope that 2021 brings much more joy than just the publication of the Better Posters book!
24 December 2020

Season’s greetings for 2020

Nope. Nothing poster related today. I’m gathering steam for January, when I hope to be blogging a lot in preparation for the release of the Better Posters book.

Meanwhile...

The Human Torch writing "Peace on Earth good will to all" in flame while Spide-Man swings by

Peace on Earth.

Good will to all.

(I hope Roy Thomas, Ross Andru, and Mike Espositio don’t mind that I changed Johnny Storm’s message just a little tiny bit.)

17 December 2020

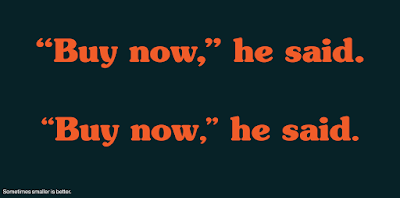
Make the punctuation in your poster titles smaller


Sample text with normal size punctuation on top and smaller punctuation on bottom

The occasional MyFonts email newsletter gave me a tip I didn’t know before. 

When you have large type, punctuation marks usually look too big. If your font is bigger than 24 points, they recommend setting punctuation points a few points smaller. 

Obviously, this applies most to titles on posters, which are (or should be!) huge.

Also remember that large type sizes often look better when the letters are spread out a little more than in book size.

External links

Fine points of designs

10 December 2020

Sports graphics, or: A moment of American football

Alex Flores recommended this video on every NFL score ever. It’s good that he recommended it, because as a huge anti-fan of American football, I never would have stumbled across it myself.

If you don’t want to watch the video, you can get a sense of what it’s about in written form here

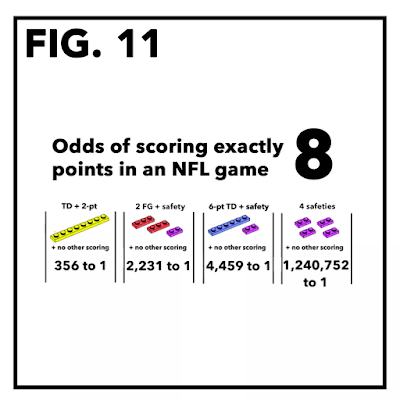
What this does a good job of pointing out is the utter numerical weirdness of American football. Whereas most games have single points, American football doesn’t. Which means scores are strangely distributed. And this makes for some interesting statistical exercises. 

Odds of scoring exactly 8 points in an NFL game

And this got me thinking about how sports graphics could be a useful source of inspiration for posters. Different games have develop different representations of play. For example, here’s a live score (or “score worm” from an Australian rules football game:

Score display from AFL game

Tennis serve placements show a fairly simple spatial representation.


Tennis serve placements from Milos Raocic in Australian Open 2019.

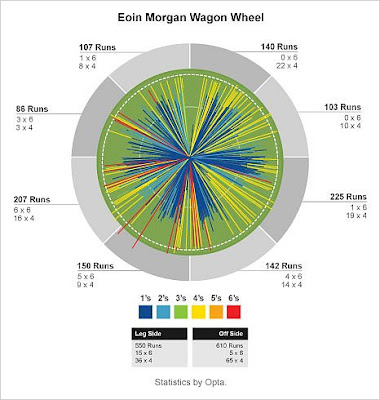
Cricket has “wagon wheels.”

Eoin Morgan wagon wheel.

It wouldn’t surprise me if sports stats graphics are often better than scientific graphics, because there is money in sports. People wouldn’t bat an eye over hiring someone just to do graphics. And the types of stats for a given sport get sort of standardized (RBIs in baseball, kicking accuracy in AFL, run rate in cricket).

Now I want to interview someone who does these sorts of thing professionally.

External links

Chart Part: Scorigami, or the story of every NFL final score that has ever happened

03 December 2020

Salmon slammin’

Felix Bernoully responded to my request for scientific graphics with a cartoon that was used in a press release. The first author of the paper drafted a single-panel cartoon using material from OpenClipArt and sent it to Felix:


This was accompanied by this caption:

Angular gyrus as part of the semantic processing area in human parietal cortex supports the comprehension of incomplete acoustic speech input in conditions in which the context allows for strong predictions regarding the incomplete word. An angling person on a Canadian river is thus much more likely to angle salmon than anything else (e.g. a shoe).

Felix had one afternoon to turn this into a more refined graphic. In two languages, no less! He wrote:

I've always been particular to the silliness of old woodcuts and wood engravings taken out of context (cf. Lucas & Morrow: What a Life! (1911)), so I decided that was the way to go.

Finding appropriate source material, preferably in the public domain, is a mix of Google-Fu (filter an image search by colour and usage rights) and rummaging through a number of sites bookmarked (e.g., The British Library at Flickr, The New York Public Library, the Library of Congress, and of course Wikimedia Commons). 
The text is set in Caslon Antique, my go-to “olde-tymey” typeface (actually a late-19th-century re-invention of well worn 15th-century movable type).

The composition was done in Photoshop, at 2,048 px width. This is a bit bigger than what is needed for the screen, but will print well at up to 20 cm (8 in) width, should the need arise.

The end result in the English version.

And this is the German version:

The German version is a little different than the English version in more than just the words.

The translation of the English cue – salmon – is “Lachs” in German, so all the other predictions the brain would be discarding because of context (angling in Canada) had to start with “La...”. Thus: Lastwagen (lorry), Lampion (paper lantern), Lasso (lasso), and Laterne (street lantern). In English "salmon" led to: saw, samovar, saxophone, and safe.

Felix notes using crosshatched illustrations has some technical considerations about resolution.

It’s always good to include a little buffer when working on pixel based images. I normally recommend about 1.5 to double the intended size as a buffer, and, of course, to use vector elements wherever possible.

The cross hatching of woodcuts and wood engravings makes them very difficult to vectorise. You’ll likely end up with insanely huge and complex files that may choke many a vector editing or PDF rendering app. So in this particular case, high-resolution grayscale (or 1-bit) bitmap images are much easier to handle.

While this particular graphic might be a little too condensed to serve as a stand alone conference poster, I could certainly see this as being a main element in a poster.

Reference

Scharinger M, Bendixen A, Herrmann B, Henry MJ, Mildner T, Obleser J. 2015. Predictions interact with missing sensory evidence in semantic processing areas. Human Brain Mapping 37(2): 704-716. https://doi.org/10.1002/hbm.23060

26 November 2020

Link roundup for November 2020

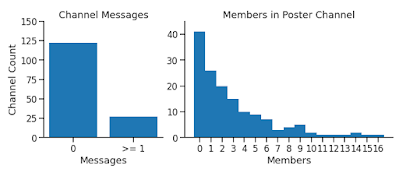
One of the advantages of an online conference is that you can more readily measure what is working and what is not. Clicks, attendance, and visits are easily measured. Lucas Braun does some analysis of an online poster session:

Poster session turnout at @cshlmeetings From Neuroscience to Artificially Intelligent Systems online conference (#NAISys on Twitter) seems to be bleak. Only ~18% of the dedicated slack channels had more than one message, and only ~55% had more than one external member. How can we do better online poster sessions?

Two bar graphs. Left: Channel messages showing <18% have a message. Right: Histogram showing mode number of poster visitors is zero.

It’s worth remembering that almost half of poster presenters in the long ago days of face-to-face conferences have given at least one poster where nobody talked to them.

I am hoping some organizers from other conferences would be willing to share their data!

• • • • •

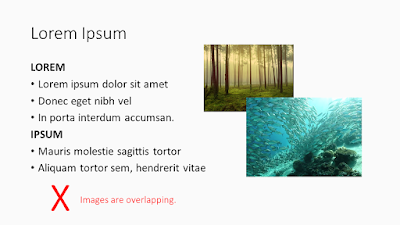
Amy Cheu has a free PowerPoint deck about designing presentations.

Sample slide showing the problem of overlapping images

Lots of good reminders in a compact space!

• • • • •

The Society for Integrative and Comparative Biology, like many conferences, is going online for its next meeting. It has created a short “tip sheet” for its online posters here. The poster material is on page 2 of the PDF.

The examples they use are pretty good, although they all have too many damn boxes!

Warning! Contains this blog.

• • • • •

Everyone’s got a chart they want gone. Nick Desbarats says were probably should stop using slope charts. Graphs that look like this:


Slope charg comparing productivity of several European countries.

This take-home message applies to all graphs (emphasis in original):

(T)he risk isn’t that readers will miss out on important insights, it’s that they’ll get completely wrong insights, which is obviously a much bigger problem.

Hat tip to Boris Gorelick.

• • • • •

A poster presentation should be short. It should also be an opportunity for dialogue. I like this article by Mark Goulston about how to stop yourself from talking too much. 

I think this paragraph might resonate with a few people in poster sessions:

One reason some people are long-winded is because they’re trying to impress their conversational counterpart with how smart they are, often because they don’t actually feel that way underneath. If this is the case for you, realize that continuing to talk will only cause the other person to be less impressed.

Hat tip to Viola Nawrocka.

• • • • •

Thoughtful Twitter thread about American election maps by César Hidalgo. He discusses that “visualizations are metaphors,” and he hits on a problem that has been bugging me about maps that try to minimize the “all or nothing” effect of by using purple:

Comparing shades of purple is nearly impossible.

Hat tip to Emily Rollinson.

• • • • •

To my surprise, César does not mention the election map from Le Monde, which won a lot of praise on Twitter.

American electoral college votes superimposed on geographic map of United States

• • • • •

And one more analysis of  American election data by cartographers. There is much more than election maps, though:

The Washington Post tried making bar charts (showing the votes that have been counted so far) supplemented by a blurry zone to the right of the bar... Perhaps this “Fuzzy Bar” would be the famous viz to come out of this year?

• • • • •

I should really stop putting out every primer from MyFonts. But they’re so good. This one about using gray is no exception (PDF).

• • • • •

Three online courses for scientific illustration.

  1. Introduction to Organic 3D Modelling: 11-22 January 2021.
  2. Naturalistic and Scientific Illustration 1: Traditional Techniques: 25-29 January 2021.
  3. Naturalistic and Scientific Illustration 2: Digital techniques, 1-3 February 2021.

• • • • •

Acdamics are cheap and always resisting paying for professional graphics software. This answer on Quora examines the difference between Adobe Photoshop and its free alternative, GNU image processing. 

Photoshop is a bit like an iceberg—what you see above the surface is only a small percentage of what’s there. You’ll find little symbols and hidden features in almost every Photoshop dialog that hide functionality most users don’t know about.

You can debate whether all that extra stuff is stuff you “need” as a poster maker for a conference. But at least be aware that the differences in the products are real.

20 November 2020

Better Posters available from major bookstores Amazon, BN, Indigo, more!

Y’all.

The Better Posters book is up on Amazon!

Screenshot of Amazon showing Better Posters

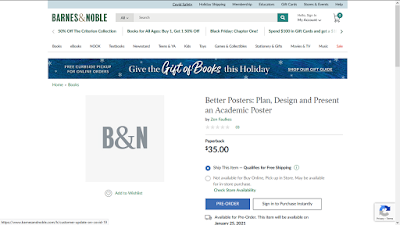
And Barnes & Noble

Screenshot of Barnes and Noble website with Better Posters

And for my fellow Canadiana, on Indigo!

And ready for pre-order! 

(These are not endorsements. Other bookstores are available and I love them all and hope you support the bookstore you love most. I love local bookstores, not everyone has a local bookstore.)

I haven’t been checking, so I don’t know when this went up. But it’s here now! 

I would be ecstatic if you would pre-order this book. Pre-orders mean a lot to a new book in terms of getting exposure, shelf space, and more.

I guess I better check those page proofs and fix those figures like I’m supposed to. I mean, it’s on bookstores so I guess it’s real!

External links

Bookshop.org (local booksellers) https://bookshop.org/books/better-posters-plan-design-and-present-an-academic-poster/9781784272357
Indigo https://www.chapters.indigo.ca/en-ca/books/better-posters-plan-design-and/9781784272357-item.html
Barnes & Noble https://www.barnesandnoble.com/w/better-posters-zen-faulkes/1137705604
Amazon US https://www.amazon.com/dp/1784272353
Amazon UK https://www.amazon.co.uk/Better-Posters-design-present-academic/dp/1784272353/ 
Amazon Australia https://www.amazon.com.au/Better-Posters-Design-Present-Academic/dp/1784272353/ 
Dymocks (Australia) https://www.dymocks.com.au/book/better-posters-by-zen-faulkes-9781784272357

19 November 2020

The AGU’s ePoster format

For a couple of years, the American Geophysical Union has had a digital poster format that it chose to call eLighning. Here’s a introductory video from 2017:

The provider for this service is iPosters. I’m sure I’ve seen their logo somewhere before, but I can’t find any earlier posts about them on the blog.

Previously, AGU used this to have people present their “posters” on HD screens instead of paper at face-to-face meetings. Obviously, in the time of COVID-19, a huge meeting like AGU is not going to happen. The society has decided that this ePoster format is the one and only way to go. No PDFs, no PowerPoint, no PNGs.

Julia Carr has been playing with this format. Her impressions (edited):

You can’t customize the layout, meaning that you’re stuck with one of the templates. You have to click on individual panels to view the content of the poster. A simpler format would be a webpage format where presenters place information in a way that is designed for online consumption, or if that's too complicated, just encouraging presenters to submit PDFs arranged to scroll down.

The template with the largest “sections” that I saw divides the poster into quarters. So bad luck if you wanted to show off a single “hero” graphic.

The “clicking panels to open” motif feels like early multi-media experiments with CD-ROMs in the 1990s, where everyone was playing with hyperlinks and embedded videos. I agree with Julia that simple navigation in one direction would be far easier than constant opening and closeing windows. Because these are landscape screens, I would seems to me that something more like a slideshow would be optimal: swipe from right to left to see the next section.

The software both encourages and discourages bad habits.

The biggest pro to this software is that the posters are easy to build, and will help avoid some of the pitfalls of other posters (for example, there's a minimum font size, and the templates are fine for setting up a conventional poster layout).

That minimum font size is 10 points, however. That may not be as bad as it sounds, because these are online. But I would definitely go larger, considering that the size is a standard Windows desktop screen: 1920 by 1080 pixels. (If you have a computer screen that size, what you see will be what you get.)

There’s unlimited space within the boxes, so I’m anticipating folks copying entire manuscripts into the space.

The software also allows for people to upload random background pictures, which I have seen it misused many times.

I’m still trying to understand why so many online presentations are trying to imitate the common form of a poster when it has been freed from the constraints of paper.

Thanks to Julia Carr for the tip and comments!

External links

Creating your virtual poster presentation

iPoster demo video (over an hour long)

12 November 2020

Critique: Tungsten carbide, part 2

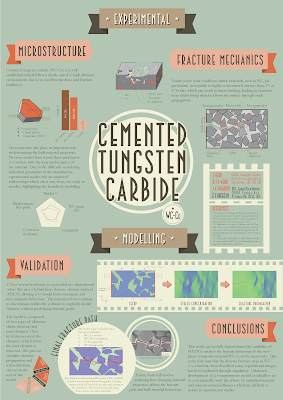
This week, more from Stephen Herd! If you haven’t seen his first effort, go back and have a peek before seeing how he pushed the envelope even further. Click to enlarge!

Poster titled, "Cemented tungsten carbide."

Stephen has this to say about this work (lightly edited).

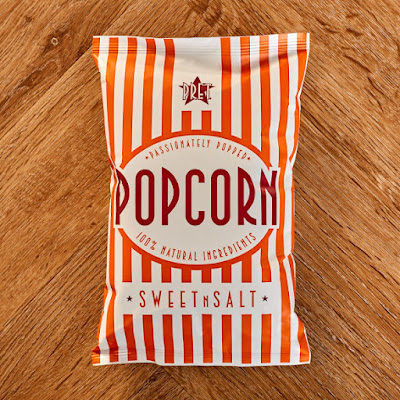
I decided to focus on the images and text would be more like figure titles. This one was more ambitious. Inspiration for the second poster came from a packet of popcorn  and also looking at movie posters.

Stephen attached this picture: 

Bag of popcorn.

I see the resemblance. I would have guessed circus posters more than movie posters, but maybe that’s just the typeface.

Stephen continues:

One of my aims was to see if you can create a poster where the title isn’t at the top of the page. This created a lot of problems in how the other elements sit on the page and how they interact with the title at the center. 

I mostly agree with Stephen’s analysis. That the title is in the middle is not an insurmountable challenge. In fact, I think it succeeds here in that it is immediately obvious what the title is. The type size, the circle, and the contrast all give the title a lot of visual weight and draw your eye there first.

The problem is, “Where do I go next?”

Stephen has two levels of headings. The major headings are “Experimental” and “Modelling.” Then there are subheadings like “Microstructure” and “Conclusion.” A problem is that the headings are too similar in size and appearance to clearly mark one as “major” and the other as “minor.”

I would have tried to stretch the “Experimental” and “Modelling” headings right across the width of the page, to more clearly separate the two sections of the poster. I think Stephen didn’t because he ended up with too much content in the “Experimental” section, and the “Modelling” banner is narrowed as a result, and once you have one heading in a narrow banner, the other gets put in a narrow banner so it’ll match.

It looks like an editorial problem more than a design problem. Too much stuff!

Stephen concludes:

While I am still not 100% satisfied with the design, the poster was successful as it brought many people over to discuss the unique design and then go on to discuss my work. 

I agree with Stephen again. This poster’s bold graphic sensibilities in the type choice, circles, and good use of text wrapping, make this stand out at a glance. And that “first glance” is critical for gaining and keeping attention.

Update: I heard more from Stephen about his choice of InDesign to create his posters.

The two main reasons I use InDesign are ease of controlling lots of elements on a single page and control of typography. Specifically:
  1. Being able to set guides on a page makes it a lot easier to create grid patterns and align objects.
  2. Putting elements on layers and controlling those layers, like locking or hiding layers. This can get particularly painful when you have lots of elements on a single page.
  3. Text wrapping is easy in desktop publishing software, but also things like drop caps, tracking, character width/height, paths etc.
Some other smaller advantages include: creating colour pallets, printing options like bleeds and efficient rendering of images ensures your computer doesn't slow down with heavy files.

I think that once you're over the initial learning curve, life is a lot easier when using the right tool for the job. I would be pretty daunted if someone asked me to replicate the poster designs exactly in PowerPoint. While you could get close to the overall design, I think it would both take longer and you would sacrifice the precise control that InDesign gives you.

Hope you enjoyed this two parter!

Related posts


07 November 2020

Critique: Tungsten carbide, part 1

I thank Stephen Herd for taking pity on me after I complained about lack of material and sharing some of his old posters. Click to enlarge!

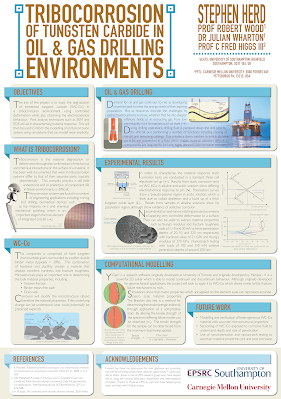
Poster titled, "Tribocorrosion of tungsten carbide in oil & gas drilling environments"

The poster was designed to print on A0 paper (for those in North America, that’s 33.1 inches by 46.8 inches).

The individual graphic elements were created in Adobe Illustrator. Stephen then assembled them in Adobe InDesign.

I think it’s worth pausing for a second to talk about InDesign.

I’ve met a good chunk of people over the years who at least know about Illustrator. I’ve seen a lot of very nice posters made entirely in Illustrator. I’ve made poster in Illustrator as part of a class I did for #SciFund.

InDesign is desktop publishing software. Desktop publishing software is something that few academics apparently know about, let alone use. Over the years, I’ve long been surprised that Microsoft’s desktop publishing software, Publisher, isn’t used more for posters. QuarkXPress is less popular than it was, but is still very much around.

Graphics software like Illustrator or CorelDraw are focused on creating an individual image. They aren’t as concerned with their placement on a page, and particularly a series of pages. The line between “graphics” and “layout” has gotten incredibly blurry, but doing page layout in a graphics program or PowerPoint is a kludge. Desktop publishing programs have print considerations “baked in,” which is probably why Publisher has often been my “go to” for posters.

Eep, that was more a moment than a second. Back to Stephen’s poster...

Stephen wrote (lightly edited):

Two area of focus were finding a more interesting way to present the title and making each section digestible. Even after I thought I minimised the words, people still read only a few sentences here and there.

I completely agree with Stephen’s analysis. Looking at it in reduced size on the blog, the title pops. It’s one of the strongest visual elements of the poster, which is exactly what you always want.

The res of the poster looks wordy. The text fades to nothingness in the main body. This is partly due to the thin lines in the font used (Gill Sans Light, I think).

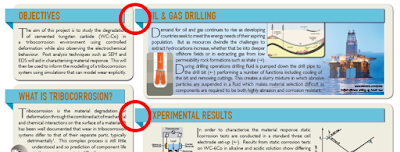
From a distance, the imminent collision between left banners and the boxes to the right is also immediately noticeable.

Poster except showing heading banners almost touching adjacent boxes.

This is not as noticeable when you look at the image enlarged, which just goes to show you need to look at your poster at a very small size to see how it holds up.

Similarly, there is a lot of detail in the illustrations. It is a little hard to judge just how close you would have to be to be able to make it out.

The positioning of some the elements within the boxes become more apparent when you zoom in. Above, you can see how close the text comes to some of the images. (By the way, text wrapping is one of those features that desktop publishing software has that graphics software often does not.)

Stephen has a nice colour selection on this poster, too. He writes (lightly edited):

One of the first things I do in my poster is decide on a colour palette. These usually consist of three colours, plus two or three shades of each colour. This helps to build consistency across the poster and hierarchy into the different elements. I ensure that diagrams follow this colour palette to help keep the content cohesive and reduce items that stand out too much on the page due to their colours.

Because Stephen was nice enough to send me two posters, I will look at his second – and much more ambitious – poster next week!

01 November 2020

One year down, three months to go

It's been a year since I made a flurry of last minute changes to the Better Posters manuscript and sent it to the editor. 

I won’t pretend it hasn’t been a frustrating year.

The book, as I’ve mentioned, was originally supposed to come out in the first quarter of 2020. The initial editing of the book went well. Then the pandemic hit, the bottom fell out of the book market and the live academic conference scene simultaneously. Pushing the release back made absolute sense.

Meanwhile, I’ve watched other books that were being written at the same time I was writing Better Posters come out. Sometimes in multiple editions or with shiny covers with foil highlights. I’ve been a little jealous.

But now there are less then three months to go! I’m still looking forward to sharing this project with you. Expect a Better Posters advent calendar in January 2021!
29 October 2020

Link round-up for October, 2020

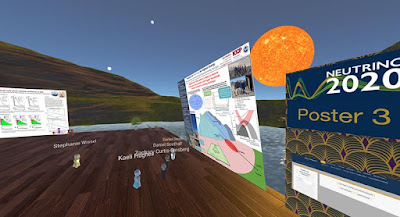
The 29th International Conference on Neutrino Physics and Astrophysics poster session looked like it came from Second Life:

Virtual poster session

Apparently nobody has heard that Second Life is a very niche community these days. Some people just can not let go of the notion of virtual spaces. 

But the organizers were happy with the outcome:

Del Tutto says the poster session was “absolutely a success.” But in the moment, it was a risky choice. Organizers, including Del Tutto himself, were “skeptical” that the VR format would work, he says. To improve its chances, Del Tutto ran a beta version for a couple dozen users about a week before the conference. Had it gone badly, they had a backup plan to run the poster session on Zoom.

The virtual format made discussion for some attendees much easier. Because the avatars’ appearances were devoid of race or gender, some expressed that they found it easier to meet and talk to new people, says Del Tutto.


• • • • •

Did you know there are fonts specifically meant for titles? Below is the same font (Perpetua) in its regular weight (black) and titling weight (white).


Perpetua Titling and regular Perpetua at the same point size.

MyFonts continues dispensing typographic wisdom in another one of the occasional primers. They write:

(Titling fonts) were specifically designed to look best in predominantly larger sizes. Titling fonts often have a more pronounced weight contrast, tighter spacing, and more condensed proportions than their text-sized cousins.

PDF here.

• • • • •

A few months back, The Word Lab featured a session on conference posters. You can now download the slides here

• • • • •

PosterPresentationLabs is a commercial design service for conference posters. Their website says they have been making conference posters for scientists since 2008, although their Instagram account started late September.

Their work looks good, although text heavy. That may be the fault of the researcher and not the designer, however.

• • • • •

The business of scientific conferences may never, ever be the same. This article in The Scientist examines the stresses that have been building on conferences for a long time, notably the carbon costs of conferences.

And people like a lot of the convenience of meetings on screens.

• • • • •

Given what appears to be the imminent death – or at least irrevocable change – of conferences, Laura Helmuth pulled a quote from this Scientific American article.

“The two scientists began collaborating in 2011, after meeting at a conference in Puerto Rico where they went to a café and talked about the overlap in their work.” Who else has started a collaboration during a conference break? I miss that part!

Andy Revkin responded:

Great observation/question - and relates to what is missing in conventional zoom-a-thons. Space to chill and explore. Anyone out there doing zoom walk-and-talk breakouts via phone? Anything sustaining this capacity? I'll do a #sustainwhat #thrivingonline episode on your ideas.

Similarly, in an unrelated thread, Guillaume Lobet wrote:

What I am missing is the interaction with colleagues over a cup of bad coffee and cheap biscuits. Interactions and networking have always been a big part of conferences for me. This is the part I miss the most! (I do not care much for fancy locations and nice hotels)

Lobet suggests a hybrid format that combines the physical meeting (for some) and recorded content (for many.

• • • • •

The Scientist article above also links out to an article co-authored by Mike Morrison (he of the billboard style poster) about boosting the impact of conferences.


The article’s bottom line: Everything in a scientific conference should be easily viewable online for free.

• • • • •

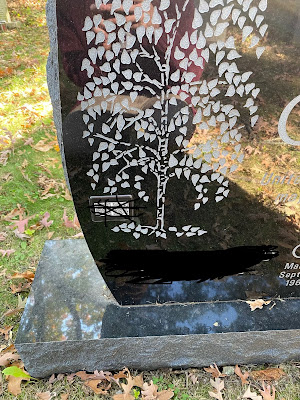
Justin Joque spotted a headstone with a QR code linking to the deceased list of papers and citation metrics.

Gravestone with QR codes obscured for anonymization.

Published and published and still perished.

• • • • •

Update, 30 October 2020: Normally, I don’t add entries to month link round-ups. Anything that I miss normally just goes into the next month’s compilation. But this New York Times article on US election maps is too timely to wait until the last week of November. 

Close-up of US election map in red and blue demonstrating how colours "pop" because of stereopsis.

Great discussion about how visualizations can deeply misrepresent reality, while purporting to be “objective.”

Also shows how unfortunate it is that political parties used bright primary colours for their branding.

Hat tip to Bethany Brookshire.

23 October 2020

Submit your scientific graphics to Better Posters!

I find myself in the embarassing position of having no blog post about this week. Unsurprisingly, the number of poster submissions for review hitting the inbox has been down. It’s been a long, hard year in the scientific conference world. The submissions have become such an integral part of this blog, and I really miss them. So despite the title of this blog being about posters, I just want to say specifically that I would love reader contributions showing any kind of scientific graphic! Illustrations, photos, graphic abstracts, you name it. Email me at BetterPosters@gmail.com!

17 October 2020

Critique: Dawn of the mammals

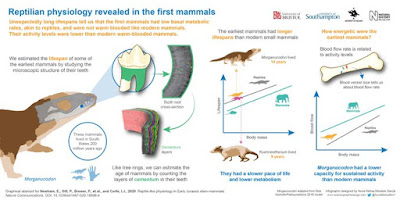
This infographic by Nuria Melisa Morales García could just as easily go onto a poster board at a conference. Click to enlarge!

"Reptilian physiology revealed in the first mammals" infographic

The highlight of this is clearly the skill of rendering. I love the mammal head and teeth over on the left. I love how callouts and arrows are used to guide you through the left half. I love the hand being used for scale to show the size of the animals. I love the icons in the line graph on the right. 

The left and right feel a little disconnected, in part because the title ends very close to the central divide. I would like to see the title bigger and running further across the top. This might means the logos got the bottom instead of the top.

Under the title is a summary:

Unexpectedly long lifespans tell us that the first mammals had low basal metabolic rates, akin to reptiles, and were not warm-blooded like modern mammals. Their activity levels were lower than modern warm-blooded mammals.

Currently, this mainly says the same thing as the title, just in several sentences instead of one. I might reword this to a narrative:

Modern mammals are warm blooded and have shorter lifespans than modern reptiles, but ancient mammals had longer lives, from which we conclude their metabolism was like modern reptiles.

Over on the right, the two graph have many nice parallels. They are both line graphs (even with similar trendlines!), both use the same colour scheme, both have icons for the animals. I wish they were even more similar.

The leftmost graph sits higher than the rightmost graph. I so badly want the graphs to be aligned, so they two X axes sit at the same height. I just want to grab the rightmost graph and move it up so it sits side by side with its left partner.

The leftmost graph has a summary statement above it, but the rightmost graph has a question above it. 

The left graph has a picture above and below the graph, but the rightmost graph only has a picture above it. 

I might tackle this by removing the Kuehneotherium in the left graph. It doesn’t appear anywhere else in the graphic, so its role is a little bit unclear. The would create the space to move the left graph down to the same height at the right one. A little text editing would be able to make the text above and below the graphs fit the new space better.

Reference

Newham E, Gill PG, Brewer P, Benton MJ, Fernandz V, Gostling NJ, Haberthür D, Jernvall J, Kankaanpää T, Kallonen A, Navarro C, Pacureanu A, Richards K, Brown KR, Schneider P, Suhonen H, Tafforeau P, Williams KA, Zeller-Plumhoff B, Corfe IJ. 2020. Reptile-like physiology in Early Jurassic stem-mammals. Nature Communications 11: 5121.https://www.nature.com/articles/s41467-020-18898-4

08 October 2020

Picking up a poster

A couple of years ago, I was out of my usual surrounds and up in the northeast of the US. I had a conference coming up, and no access to the department’s printing services. So I have a poster printed commercially by MegaPrint. They do a lot of research posters. 

I looked at the address, and realized it was... pretty close by, all things considered. Cheaper and more fun to get it instead of having it shipped by courier.

So I drove over and picked up the poster, because I was kind of curious to see a place that handled so many conference posters.

I missed the sign the first time and had to turn around and go back.

MegaPrint sign by highway surrounded by trees

Their business is a little ways out of town, nestled into trees.

Inside, calm, unassuming, with rows of large format plotter printers.

I got a chance to talk briefly to their founder Jay (since retired) about how they got into doing so many research posters. A friend of his mentioned scientists were always making posters, so that became a big part of their business. 

And I got my poster!

Poster laying on table

It was nice to have a moment of connection to a business that has, in a quiet way, been so integral to so many presenters at scientific conferences.

01 October 2020

Journals need to set a better example for posters

I recently ran across a figure in a journal (and a journal I respect) that made me look sideways at it. I am suspicious of composite, multi-panel figures at the best of times. But oh boy.

First, this was the layout of the elements in the figure.

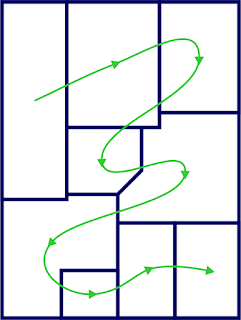
Nine elements should be easy to lay out. Make a three by three grid heights and widths. Instead, we get this bizarro layout where only two elements are the same height or width (bottom right corner). The five and eight sided polygons in the middle are making me cringe. 

But based on the blocking of the elements, I thought I might be able to go through the figure in a sensible way. It looked to me like I should go across, then down.

But no. When I looked at the numbering and figure legend, I found I was supposed to read the figure in this order.

So the actual reading order for this figure is a drunkard’s walk that includes right to left transitions and backtracking across previously covered terrain.

At least the ordering starts in the upper left and ends in the lower right.

I can understand authors making a figure like this. Scientists are not graphic designers. But what I can’t understand is why a journal editor didn’t have something to say about this. Something to say as in, “Redo that figure.”

Posters are deeply influenced by journal articles. They almost always have the same elements as a journal article, even though there is rarely a need to imitate the format. So slipshod graphics in journals have a ripple effect. They sets a poor example that readers who later make posters might imitate. People think it’s published so it must be okay.

It could be so much better.

I get the impression that a few journals have dedicated graphics staff who often work with authors on their illustrations. I wish that professional graphics designers were employed more widely by journals, and that the journals advertised that.

24 September 2020

Link round-up for September, 2020

SciMobi is a new service for delivering poster-like content online. (I say poster like, because if it’s not on paper, is really it a poster?) Phil Greenhalgh has a pair of posts relevant to our interests here at LinkedIn. 

The first is on QR codes. It arrives at the same conlusion of some earlier posts on this blog (always say what they lead to!).

The second is partly about the billboard poster format that has been the subject of much discussion. It uses a nice metaphor of catching. Throw one ball and someone can probably catch it. Throw a lot, and they will drop them. Excerpt:

Alas, when working in some of the most highly regulated industries in the world, the luxury of brevity isn't always one we can afford. The amount of balls is sometimes beyond our control, we are compelled to become jugglers. If the content just positively has to be there, it becomes our job to not throw the balls all at once at our audience, but to hand them safely one-by-one so they are not dropped.

Scimobi will soon have a 15% discount for Better Posters readers! I will announce it on the Better Posters Twitter when it’s ready. Thanks to SciMobi!

Update: The SciMobi discount code is:

betterposter15

It is good for three months (i.e., until mid December 2020).

• • • • •

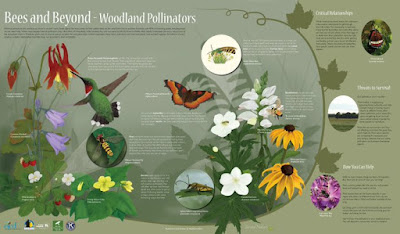
Echo Rivera scored a coup with this awesome guest post from Heather Hinam. Heather makes posters for a living - only she knows them as “interpretive signs” for public displays like parks and museums and the like.

Bees and pollinators interpretive sign

Heather provides a breakdown of her process of making these rich, complex signs. I like this tip: write your text last!

Now that everything is where I want it to be, I finally start writing the text. I know some of you reading this will find it counter-intuitive, but by doing it this way, I never end up with too much copy. I can only fill the space that I have created.

While the target audience is general rather than academic, many academics would do well to look more at these sorts of signs as inspiration!

• • • • •

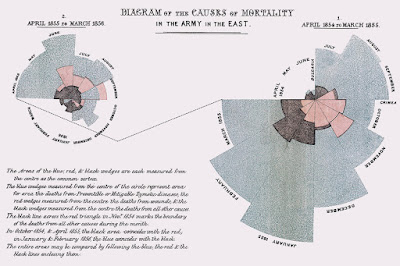
Florence Nightengale, she of nursing fame, was also a dataviz nerd.

Diagram of the causes of mortality in the armies in the east

Hat tip to Emily Anthes.

• • • • •

What art can do for science. Hint: way more than public engagement. How about:

  1. Change your perspective.
  2. Use data to create art and vice versa.
  3. Create new visual metaphors.
  4. Broaden frames of reference.
  5. Get inspired!

At Lifeology.

• • • • •

Kris Faraldo describes how to use PowerPoint make graphics fast with minimal graphics skills. (PowerPoint really is good for quick and dirty images.)

• • • • •

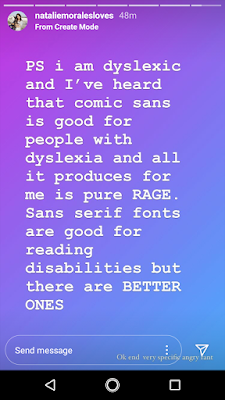
I am a big fan of actor Natalie Morales. Near the end of August, she dished some personal experienced with typography on Instagram.

The fact that people on here have the option to use Comic Sans is very upsetting to me

I'm dyslexic and I've heard Comic Sans is good for dyslexics but all it produces in me is pure rage. There are much better ones.

 As far as I am concerned, her word is law.

• • • • •

The first graphic novel created in India, The River of Stories, was recently reprinted. It’s a story of indigenous people, economic development, journalism, and more.

"The River of Stories" cover

The River of Stories is (mostly) English, and you can view it here (part 1) and here (part 2).

• • • • •

All for now!

18 September 2020

BioRender announces PosterRender

“Darn it, I don’t have a blog post lined up this week. What am I going to write about...?”

[Checks Twitter]

psst @DoctorZen have you seen!?

[Sees]

“Well, that’s this week’s blog post sorted.” 

BioRender just announced a new project, PosterRender. This cloud-based software features automatic alignment and global colour schemes.

It’s rare that I get to say, “Big news in the conference poster world!” But this is big news in the conference poster world.

I knew the company was thinking about a project like this, because a BioRender staffer consulted me at one point about the poster making process. I probably didn’t help much! 

This announcement is getting thousands of likes and retweets. I am not going to lie when I say I have mixed feelings about this. On the one hand, that a successful company like BioRender is throwing its weight behind poster making is fantastic. This will be a great boon for many people. 

On the other hand, the first glance suggests that this fundamentally a souped up template, and I have consistently struggled with templates. Templates prevent people from falling in deep dark holes, but they also generate a certain sameness that can be bland. BioRender figures have a recognizable style.

I also have a bit of a frown because the announcement says this is for people “who spent way too long making poster.” This was also an explicit selling point of the “billboard” style poster, as I mentioned last week.

I don’t like the implication that posters aren’t worth spending time on. 

It reinforces the idea that posters are third-rate ways of presenting scientific information. I never see people say, “You’re spending too much time on writing.” Nobody begrudges a few hours spent on creating a journal article, because people recognize that good writing takes time. Posters are a critical first draft of the scientific record. Take them seriously, damnit.

But I’m probably like the music nerd arguing that vinyl records “sound better” when the rest of the world has moved to listening to streaming music. 

This is going to be a very big success for BioRender and help many people make more readable and more attractive posters than they could have on their own.

Early access to PosterRender is available here. And you better believe I have signed up! I am excite!

Hat tip to Catherine Scott.

External links

BioRender PosterRender early access sign-up


10 September 2020

blog post with conference poster advice

A recent episode of the podcast 99 Percent Invisible looked at the rise of grocery store brands, and spent a lot of time examining generic brands.

No name baking soda

The example pictured is from No Name line of products from the Canadian supermarket Loblaws. In the late 1970s and 1980s, Loblaws started these generics as a cheaper alternative to national name brands. 

Of course, this “anti-brand” is in fact an instantly recognizable brand. The moment something becomes the subject of jokes, which No Name has often been, that’s a culturally significant brand.

Marketer Terry O’Reilly says of the No Name design:

You don’t have to pay for the mass advertising and all the design work and all the marketing that goes on behind that jar of jam. All you should be paying for is the jam. And Nichol called that “brand tax.”

This No Name attitude is shared with a certain section of the scientific community who declare that scientific papers are mere “ads for data.” These are the ones who thumb their nose at reviewed, editing, proofreading, and typesetting. None of that should matter, only the jam / data matters.

And No Name’s ultra minimalist design also reminded me of... the billboard style poster

Poster template saying, "Teach people something cool you learned in 5 seconds as they walk by (or scroll by)."

On his original YouTube video, part of Mike Morrison’s argument for the billboard style poster was that people making posters (usually students and other early career researchers) shouldn’t be spending the time for the design work on a poster. Call it the “design tax” instead of a brand tax.

I couldn’t resist doing this:

Conference poster in No Name style with bright yellow background and black Helvetica text

But the 99 Percent Invisible podcast goes on to describe how the generics, like No Name, started to lose appeal. Loblaw’s kept No Name, but started a new, upscale line called President’s Choice. It was led by a chocolate chip cookie, The Decadent.

President's Choice Decadent chocolate chip cookie

President’s Choice was a 180° pivot from No Name. As much as No Name reveled in DGAF minimalism, President’s Choice reveled in slick design. 

Both were created for the same stores, but as of now, President’s Choice became the more successful model. If you live in the United States, you might see the Walmart equivalent, Sam’s Choice.

And the moral of the story for posters is:

There is no optimal design. No Name and President co-exist in the same stores. One does not drive the other to oblivion.

Many people like nice packaging. As much as some researchers are say they only care about content – the only thing that matters in the jam in the jar or the data in the graph – when people vote with their dollars, they quite often choose the thing that has put more effort into the packaging. 

To some degree, the billboard style poster demonstrates that same trendline. If you haven’t looked at the material on the Open Science Framework lately, the current template is up to version 43. The number of styles is more varied and the designs are more sophisticated. For something that originally billed itself as something fast and time saving, a lot of effort has gone into refining the design for more uses for more people.

Update: No Name has an A+ Twitter game.

Graph in No Name style showing scatter plot of pie related products. Titled, "Pie chart. May contain data."

External links

podcast episode on 99 Percent Invisible

03 September 2020

Critique: The great cleave

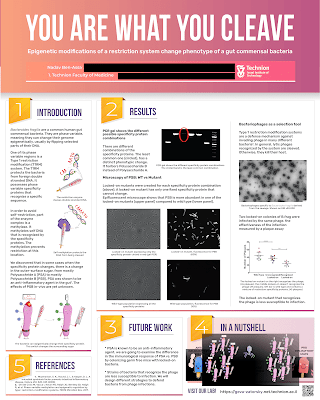
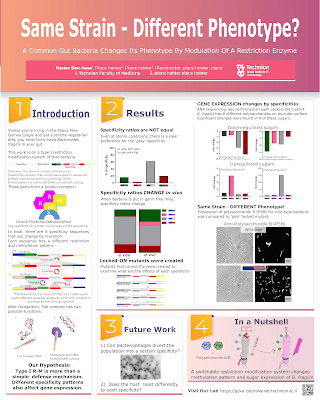
I love seeing how people’s approaches to posters change over time. I am tickled we have a trio of posters from Nadav Ben-Assa. Click any of them to enlarge!

"You are what you cleave" poster 1

This first iteration is a clean, straightforward design that shows lots of good design decisions. There a clean columnar layout. The text and images are integrated. The margins are generous and have lots of white space.

The “In a nutshell” section has a few decisions that I might question. “In a nutshell” is clearly a summary box. The logical places to put a summary are the top left or bottom right. The sidebar in the bottom middle is okay. But I wonder if the sidebar is in that position “because it fit there,” rather then, “This is where it should go, so I’ll make it fit.”

There are some parts of the poster I would like to see more edges aligned.

Perhaps the main issue with this first iteration is that it doesn’t have a lot of personality. The title bar is a sort of unassuming brown. The sort of colour you might expect a 1970s kitchen to be.

Version 2 of this project does not have that issue.

"You are what you cleave" poster 2

Right away, you can see so much more personality! The colour choices are more bold and frankly, more fun. The title has gone from a generic sans serif to a condensed typeface that is bigger and easier to read. The text and images are integrated in a more sophisticated way.

The is still one thing that immediately makes me twitchy. The use of numbers to signpost the reading order is excellent. However, it does draw attention to “5. References” down in the lower right corner. You travel from section “1” to section “4” easily, then... you have to throw the car in reverse and back up all the way to the other side of the poster. Because the poster is in portrait mode, the distance from corner to corner isn’t great, but it’s jarring to glance at the poster and see, “1, 2, 5, 3, 4.”

Just remove the number “5” and the problem goes away. You don’t need to give directions to optional fine print.

Version 3 clearly has some of the same DNA as version 2.

"Same strain - different phenotype?" poster

The signposting issue is gone, and the numbers fall in their expected order! 

The more confident colour choices are starting to extend into the figures used. Compare this to the first poster, and you can see how many more little spots of colour are popping out.

There also seems to be less text in this version than the previous two.

The title, you note, has changed. Nadav liked the title, but it wasn’t connecting with the audience. I think this is a good lesson: you only improve certain things by testing it out on other people.

There is a very clear improvement in graphic design with each version. We can all only hope to improve as much as Nadav!