26 May 2022

Link round-up for May 2022

Lots of great posters shown in winners of the 12th International Meeting on Visualizing Biological Data. Special congratulations to Mol Mir for the Best Scientific Poster award with this:

Poster titled, "Using illustration as a primer for interpreting cellular EM data"

Excellent use of colour and illustration here!

 • • • • •

Occlusion Grotesque is a typeface designed by a tree.

Occlusion Grotesque sample reading, "designed by a tree"

Plant biologists, I think you might need this for your next poster! Maybe not for the main text, because it might lack a few specialty characters, but for headings or a title? So. Perfect.

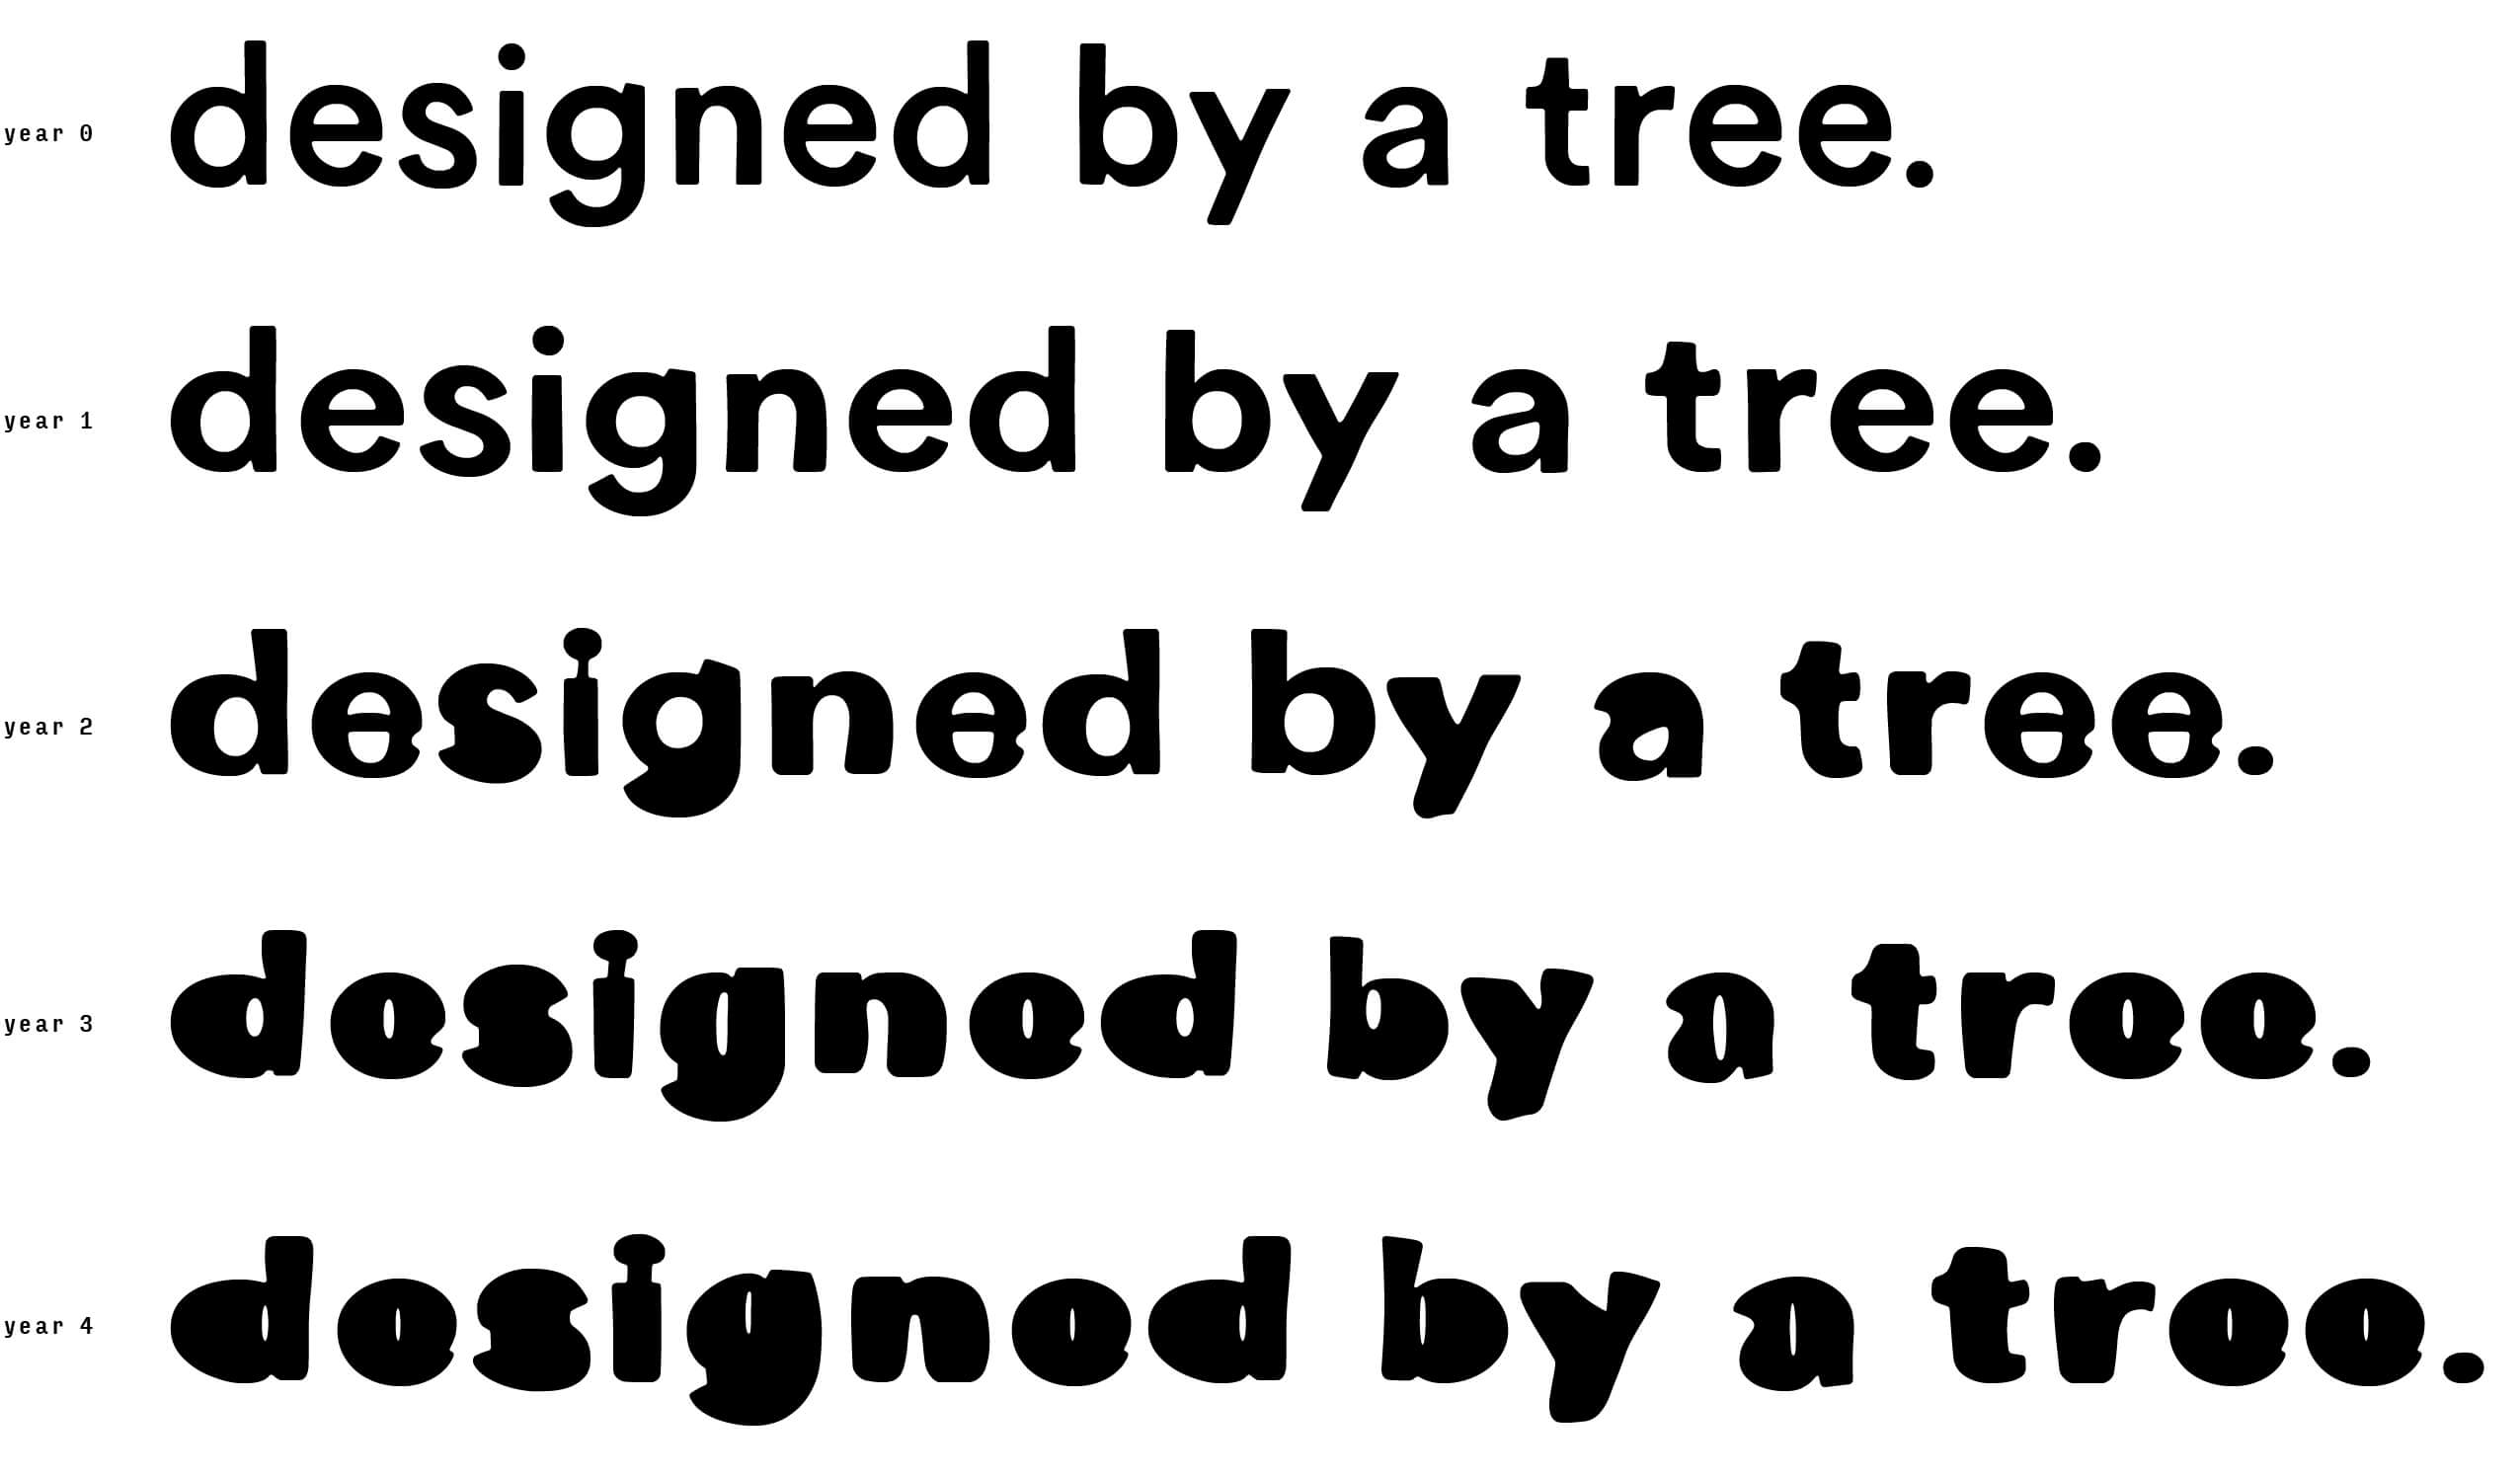
Fascinating project from Bjørn Karmann all round. Check out the whole post.

• • • • •

Sanjay Manohar shows that 3-D graphs shown as flat, static illustrations have an ambiguity problem:

3-D graphs are ambiguous without a projection. Each point has a whole ine of possible 3-D locations.

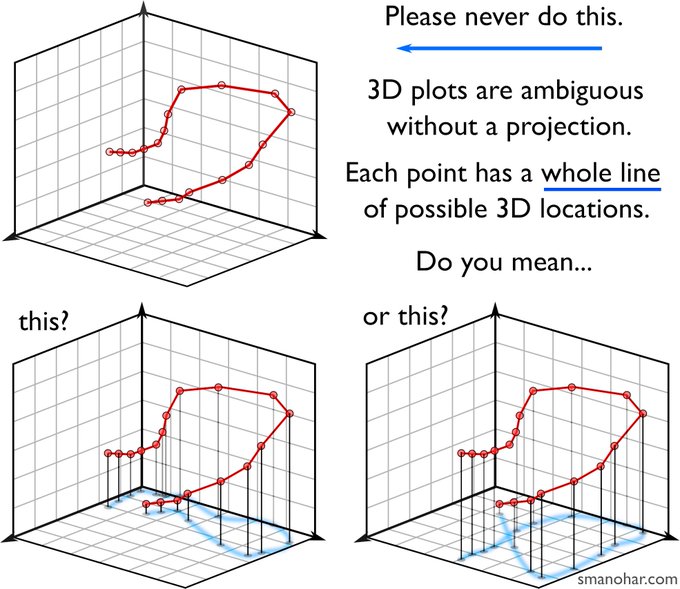
 Another solution besides drop lines is to present the graph as a stereo image.

• • • • •

Because of the attack on Ukraine, some popular typefaces –like Times New Roman – have been blocked in Russia. Hat tip to Peter Singer.

• • • • •

Tristan Long makes probably the nicest looking department seminar posters you’ve ever seen. They’re so nice, they got turned into a colouring book.

Seminar announcement featuring dragonfly in art nouveau style.

 Hat tip to Ryan Gregory.

• • • • •

Dawn DiPeri has an open access – which is to say, free – book on graphic design, aimed at instructors. It’s titled Graphic Design for Course Creators.

Cover for "Graphic Design for Course Creators"

I learned about this book on the Lecture Breakers podcast (episode 122, the one right after mine).

• • • • •

A new-to-me suggestion to make small groups discussions inviting to others.

The Pac-Man Rule

The rule is:

When standing as a group of people, always leave room for 1 person to join your group.

More memorably, stand like Pac-Man!

Pac-Man

From Eric Holscher, with a hat tip to Leonardo Collado-Torres.

• • • • •

Some neck craning seems to be required to read the poster spotted in the background of a conference snapshot:

It appears someone confused landscape dimensions and portrait dimensions. Could be conference organizers, could be poster creators, could be someone else.

• • • • •

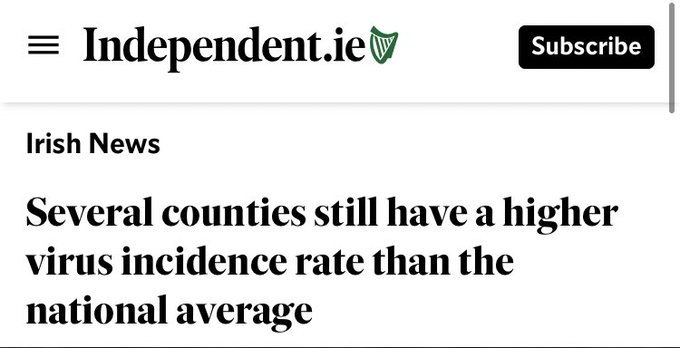
An interesting typesetting effect that someone called “bionic reading.”

Two side by side text samples. The right is all in one weight. The left has the initial letters of words in bold.the

But this is only one sample. It’s not clear what is causing this effect. The sample on the left is pretty light weight text, and maybe it’s just more bold.

From Christophe Pasquier. Hat tip to  Moritz Stefaner.

• • • • •

New to me paper on the way colour combinations can signal emotions.

Bartram L, Patra A, Stone M. 2017. Affective color in visualization. Proceedings of the 2017 CHI Conference on Human Factors in Computing Systems. Denver, Colorado, USA, Association for Computing Machinery: 1364–1374. https://doi.org/10.1145/3025453.3026041

Hat tip to Lisa Charlotte Muth.

• • • • •

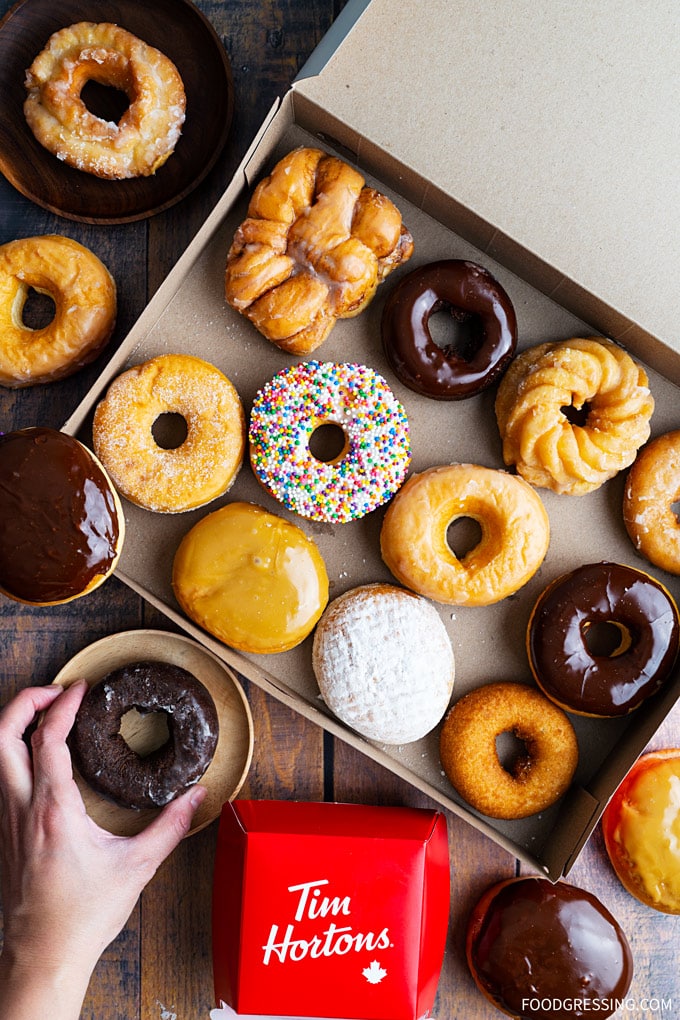
This month’s best re-use of a poster, from Allison Herreid:

Allison Herreid sleeping with fabric poster as blanket and blindfold saying, "Wake me when we get to Queensland."

Hat tip to UNH Research.

• • • • •

It feels premature since the end of the pandemic is nowhere in sight, but Schreiner and Badawi debate whether research conferences should remain virtual after the pandemic ends. Excerpt from “Stay virtual” position:

(V)irtual meetings can be designed to cover all aspects of scientific and networking important for conferences. ... (I)t seems that the virtual conference is here to stay, at least as some component of all future conferences.

And on the “No more virtual” position:

(T)he most critical challenge for purely virtual conferences is the building of networks and the honing and synthesizing of new ideas, most of which takes place in animated conversations in front of posters, in serendipitous meetings in the corridors, and in the bar or over dinner. ... The sooner we are meeting face-to-face again, the better.


Schreiner LJ, Badawi R, Baldock C. The post-COVID future of research conferences should be virtual. Physical and Engineering Sciences in Medicine. In press. https://doi.org/10.1007/s13246-022-01138-y

• • • • •

Animate Your Science has a post on creating a poster template

But honestly, this isn’t so much about creating a “template” as it is doing the simple first steps towards laying out a poster. Set the paper size, set up a colour and font schemes, etc.

• • • • •

I will be vain and end this month with a link out to my own Twitter thread analyzing one of the best selling posters of all time (by the Hildebrandt Brothers) and the lessons it has for academics.

Star Wars poster by the Brothers Hildebrandt.

It was May the Fourth

19 May 2022

Listing authors: Lessons from movie posters

Movie posters have very different goals than academic conference posters. But both increasingly have one thing in common: they have to fit a lot of contributors into a limited space.

Here’s a recent example. Click to enlarge!

One sheet poster for "The Lost CIty" movie (2022)

Let’s zoom in on that bottom credit block.

Credits for "The Lost City" movie (2022).

In that space, we have:

  • One studio.
  • Three production companies.
  • Five actors.
  • One title.
  • Six technical creators.
  • Six producers.
  • Five writers.
  • Two directors.
  • Three social media hashtags.
  • Soundtrack availability.
  • Sound system.
  • One studio logo.
  • One release date.

All of that is contained within just 12% of the poster. That's an efficient use of space.

Much of that efficiency is coming from the narrow typeface. This is a well established look for movie poster credits. The credit list on the classic poster for Jaws (1975) look very much like the one above.

One sheet poster for the movie Jaws (1975)

Classic typefaces like Univers have a huge range of weights, down to skinny condensed fonts.

"Written by Zen Faulkes" in Univers Next Pro 210 Condensed Thin type

There are plenty of options, however, such as the descriptively named Tall Skinny Condensed, below. This one is a little less readable because lowercase letters are larger (technically, they have a larger x-height).

"Written by Zen Faulkes" in Tall Skinny Condensed type

Triple Condensed Gothic Medium, below, has no lowercase options, which might not matter for some purposes. The movie poster above has few lowercase letters.

"Written by Zen Faulkes" in Triple Condensed Gothic Medium type

This next one below, set in Bee, is my favourite.

"Written by Zen Faulkes" in Bee Two Normal type

The movie credits also use space efficiently by making job descriptions about half the height of the name. 

"Written by Zen Faulkes" in Opinion Pro Extra Condensed Light type, with "Written" on top of "by".

This is a trick that might be applied to institutional affiliations, which always try to chew up space on posters, especially where there are collaborations.

"Zen Faulkes, McMaster University” set in Opinion Pro Extra Condensed Light, with “McMaster” on top of "University," both of which are about half the height of the name.

Meanwhile, if the same information on the movie poster was on an academic poster, it’d probably look something like this:

Credits for "The Lost World" if done by academics.

The “movie credit” style makes more sense than the “footnotes” style because it follows a basic principle of graphic design: keep related things together.

Another thing that is notable about movie posters is that the credits are normally at the bottom of the poster. Sure, the “big names” of the actors or director might be up at the top, but the full list is not.

This is another thing that academic posters might imitate, particularly for big collaborative projects. The poster presenter – the most relevant name – might be the only name up at the top, and the full list of contributors might be down along the bottom.

Related posts

Showing authorship on posters

External links

What font do they use for movie poster credits?

Hat tip to Mike Morrison for this prompt. (Movie credits are mentioned in one of his YouTube videos, “How to create a better research poster in less time (#BetterPoster generation 2)”. 

17 May 2022

Is the future of posters a bunch of big screens?

Paul Bracher (ChemBark) sent a message from the Astrobiology Science Conference (#AbSciCon22 on Twitter) conference that seems to have come close to getting an electronic poster session right.

Conference room with large screens for showing posters.

The infrastructure was provided by iPosterSessions, who have appeared on the blog before. Rooms have up to 10 screens. Poster sessions are 90 minutes, and begin with 3 minute talk from each presenter. Presenters and audience can then visit individual posters.

Paul saw advantages.

I like that I didn’t need to print ($/time). I like that I can edit mistakes. I like that I can leave making it to the last minute. I like not carrying a tube. I like I can browse posters far away, without fighting crowds in my wheelchair.

Not everyone responded so well. Some pointed out that screens are expensive and more prone to failing than paper. The replies in the thread make for interesting reading.

Regardless of the success at this conference, I doubt we will see this adopted wholesale for the big meetings like Neuroscience and AGU any time soon. I can’t imagine anyone is willing to buy the thousands of screens that would be needed to replace all the poster boards in those venue any time soon.

Clearly much more to come on electronic posters, how they are used, and so on.

Related posts

The AGU’s ePoster format 

The Scholarly Communication podcast

Scholarly Communication podcast logo
I’m fortunate enough to be on the Scholarly Communication podcast with Daniel Shea! (I think it’s episode 91, but they don’t number them by default.)

While the ostensible reason I was on was to talk about the Better Posters book, the conversation ranged widely. Daniel and I talk about narrative, collaboration, and efficiency in the realm of academic communication more generally.

Here are a couple of posts I mention during the interview.

First, this is the post where I talk about my wariness anyone says, “We need to do a better job training Ph.Ds in...”.

Second, this is the post where I talk about how my writing class completely, totally, 💯 rejected the idea that storytelling has any place in science. So storytelling is dead, long live narrative.

You can listen at the New Book Networks website or probably any other place you get your podcasts (like Stitcher).

External links

Scholarly Communication podcast home

Scholarly Communication: Better Posters

16 May 2022

Poster sessions for your course

Lecture Breakers podcast logo

When I was on the Lecture Breakers podcast (episode 121), I talked to Barbi Honeycutt about how to use posters in a higher education  I wanted to follow up and talk a little more about how to pull together a poster session for a course.

Like a successful course, a successful poster session does require a little planning in advance.

Pick a place

Key to a good poster session is where you hold the session. There are few options.

Classroom

There may be enough space to hang posters within a classroom if it is small. The main advantage of trying to have a poster session in your regular classroom is that you already have a space. You don’t have to ask anyone else to use it.

Another advantage is that of having it the classroom is that you may be able to display posters on blackboards or whiteboards, which are less likely to be damaged by having posters attached.

Hallway

Compared to a classroom, moving a course poster session into a hallway means you get:more space and more visibility. Visibility in particular is helpful because one of the main reasons to do a poster session is that the work can be shared more readily.

Potential drawbacks are that hallways on campuses attract all kinds of fliers and ads and posts from students, organizations, and other faculty, so there may not be enough clear space for course posters.

Another issue is how to display the posters. If the wall is painted, tacks or adhesives could damage the paint and not endear you to physical plant. You might be able to procure some poster boards from the campus physical plant or some administrative office, but if you’re going to do that, you might want to pack up and move...

Atrium

Poster session going on in university atrium
There may be some big open space on campus. There might be an atrium in your building, a campus ballroom or meeting space for events, or even a basketball court. 

You would need to plan ahead.for this option, because large rooms like this tend to get booked quite far in advance. Plus, as mentioned above, you would probably need to get someone to bring poster boards. 

Some campuses may not have poster boards, but some might have easels.

If your campus has neither, you might be able to make a case to buy some as teaching supplies. Because these could be used for so many purposes, you might be able to make a good justification to a college Dean’s office or university event planning, not just your department.

Promotion

You can have a course poster session that is seen only by the instructors and students in the class, but this seems like such a waste of an opportunity for students to get more feedback.

If you are holding your poster session in a hallway, you automatically have some visibility. Some people, both students and faculty, might stop and chat just out of curiosity. 

Email colleagues in your department. Invite them to come and ask students questions. You might want to be selective about asking faculty colleagues, though. You might want to ask people whose research interests are closest to the class. You might want to ask people you are friendly with that you can count on to ask not to rip through students.

Give students explicit permission to invite their friends.

Some campuses may have a campus wide email blast about daily events. Ask them to put your poster session in for a couple of days before you hold it.

And you can use the graphic design skills you used for full sized posters to make fliers before the event!

Munchies

No campus event for students is complete without free food!

And don’t skimp on munchies! Trust me, I speak from experience.

At one class poster session, a colleague of mine had brought boxes of donut holes. I was interested (because hey, poster session) and showed up with a couple of boxes of full donuts.

In mere minutes, the donut holes had been hardly touched, but all the donuts were gone.

Do you have more tips for a course poster session? Encountered more pitfalls? I’d love to hear about any experiences you have holding a class poster session!

Related posts


External links 

 
Atrium picture from University of Rochester website.

12 May 2022

“This can’t be real, can it?” Oh, this poster is real and it is something to behold

You need to click to enlarge to truly appreciate what is going on in this poster.

Poster by Manolis Kellis on ALzheimers that contains a very large amount of data

What you see above is a poster by Manolis Kellis that was being presented at The Biology of Genomes meeting (#BoG22) at Cold Spring Harbor Labs. The conference ends in a couple of days (10-14 May 2022).

It’s pretty rare for a poster to get singled out by an organizer, but Kellis reports Luis Barreiro said at the conference introduction, “The only thing more full than the auditorium tonight is Manolis Kellis’s poster.” Kellis tweeted, “Ahem... you be the judge.”

Judgements did indeed come in.

I have reached out to Kellis for further comment. In the meantime, I just want to direct you to the responses to his tweet, which are Twitter’s usual mix of funny, sincere, upset, and a few other emotions thrown in for good measure.

Here are a couple of tweets that are not in Kellis’s thread.

Lior Pachter wrote, “This ‘poster’ at #bog22 is obviously some kind of a joke. But unclear what the punchline is.”

Arnav Moudgil wrote, "This can’t be real, can it? Can someone at #BoG22 share a picture of this poster actually printed and tacked up?”

Gregor Kalinat wrote, “If you ever wondered if plotting a whole poster session on just one poster was a good idea ... at least it seems doable 🤔”

Other easy reads don’t use bullet points. Maybe your poster shouldn’t, either.

Bullet points are overused on conference posters. But many people recommend them, often claiming that bulleted lists are “easier to read.”

If bullet points were truly easier to read, you should see them in publications aimed at wide readership.

People magazine logo
Like People magazine.

Here’s the first few paragraphs of an article on the People website about Selena Gomez.

"n April 26, 2022 02:00 PM Advertisement FB Tweet LOS ANGELES, CALIFORNIA - APRIL 09: EP/Actor Selena Gomez from Hulu’s ‘Only Murders in the Building’ attends Deadline Contenders Television at Paramount Studios on April 09, 2022 in Los Angeles, California. (Photo by Amy Sussman/Getty Images for Deadline Hollywood ) Selena Gomez | Credit: Amy Sussman/Getty for Deadline Hollywood  Selena Gomez is teaming up with the White House to end the stigma around mental health.  On Tuesday, MTV Entertainment announced it'll be partnering with the 29-year-old Revelación singer and her makeup brand Rare Beauty's Rare Impact Fund to host the first-ever Mental Health Youth Action Forum in coordination with the Biden-Harris Administration on Wednesday, May 18 in Washington, D.C.  Presented as part of MTVE's Mental Health is Health Initiative, Gomez and her organization will join 30 previously-announced mental health youth activists at the Forum, geared toward empowering young people to embrace conversations about mental health. The event takes place the day before Mental Health Action Day, which will see organizations, brands, government agencies, and cultural leaders come together and encourage people in need to seek mental health support."

Here’s the start of an article quoting Laila Ali.

"  Katie Taylor and Amanda Serrano will make history on April 30 when they become the first female boxers to fight in a main event at Madison Square Garden.  "They're having an opportunity to fight as the main event at Madison Square Garden for the first time in the history of boxing," former superstar boxing champion Laila Ali tells PEOPLE about what the event means for women's sports. "That's what we've always wanted. I've been saying that from the time I was boxing, that we want to continue to help women's boxing grow."  The former boxer — whose record is undefeated — began her professional career in 1999 and competed until 2007. Throughout her own career and still, Ali has been passionate about female boxers receiving their due praise, from higher compensation to endorsement deals."

Weekly World News logo
But maybe you think People is still too high brow? How about the infamously goofy tabloid, The Weekly World News?  

Here’s a recent article about bird attacks:

BLACKBIRDS ATTACK KENTUCKY! April 5, 2022 by Tap Vann  Millions of birds are attacking a small Kentucky city –  destroying buildings, parks and injuring thousands of citizens.  The blackbirds and European starlings blacken the sky of Hopkinsville, Kentucky, before roosting at dusk, turn the landscape white with bird poop, and the disease they carry can kill a dog and sicken humans, causing a number to die a slow and painful death.  They are swooping down and attacking humans – focusing on eyeballs and ears.  “These damn blackbirds practically ripped off my ears,” said Jud Buckman of Hopkinsville.  “My eldest son lost his left eyeball.  I’m gonna get out my shotgun and start shooting!”  “I have seen them come in, and there are enough that if the sun is just right, they’ll cloud your vision of the sun,” said Hopkinsville-Christian County historian  Jefferson Turnabot. “I estimate there are 30 million of them.”

Huh. No bullet points there, either.

Sport Illustrated Kids logo
How about a magazine specifically aimed at novice readers? You know, for kids? Like Sports Illustrated Kids? If bullet points are easier, surely they would want to make their magazine accessible to kids?

From an article about their “Sportskid” of the year:

"When his daughter Zaila was around 3 years old, Jawara Spacetime changed her last name to Avant-garde. The term is used to describe art that is innovative or cutting edge. Jawara chose it to honor the late saxophonist John Coltrane, a popular musician in the 1950s and ’60s who embraced avant-garde jazz—much to the dismay of many of his fans and critics.  “There was some pretty big backlash to what he was doing,” Jawara says. “Critics said, ‘It’s just noise.’ But he loved that music. For my kids, I wanted them to be able to persevere and do what they love. Live your life to the fullest—and be passionate about whatever you’re doing.”  Now 14, Zaila has certainly embraced a wide range of passions. Such as spelling (she won the Scripps National Spelling Bee this summer). And basketball (she has set multiple world records for dribbling and is an elite-level player). And reading (she’s devoured more than 1,000 books)."

Again, you don’t really see bullet points. 

Kids magazines are kind of holdouts in mainly being in print and not online, I can’t find a current issue of Ranger Rick online, but here’s a sample of a 2016 article (the magazine’s fiftieth anniversary).

Ranger RIck magazine article about chameleons.

You should be expecting it by now. No bullet points to be seen.

So professionals who are genuinely trying to make things easy to read because that is their specific target audience do not use bullet points. I think we are reaching the point where we can say that “bullet points are easy to read” is a myth. Or if not a myth, not standard practice. It seems to be academics in particular who have a bullet list fixation.

I think the only reason this advice comes up so often for posters is because PowerPoint is so often used to make posters.

Related posts

Bullets versus sentences

Link roundup for February 2022 

10 May 2022

Reading bar graphs is harder than we thought

One of the most powerful ideas in statistics is that you can summarize an indefinite amount of data with just a couple of numbers. For example, a mean and standard deviation can tell you a lot about millions or data points.

For that reason, I’ve always had mixed feelings about the saying, “Friends don’t let friends use bar graphs.” The argument is that you should always plot all the data points because summary statistics can be misleading if the data have unusual distributions. This seemed to me to be throwing away one of the central ideas of statistics. In the Better Posters book, I argued that showing a summary bar graph is fine if the underlying data meet normal assumptions.

I am having second thought on that because of a paper by Kerns and Wilmer (2021) about how people read bar graphs.

Bar graphs can show at least two things: quantities or averages. Kerns and Wilmer are concerned with averages. They show that about one in five people (20%) misunderstand what a bar graph is showing. They treat the end of the bar as the upper limit of a range, not a mean.

Kerns and Wilmer call this the bar-tip limit error.

They found this by showing people bar graphs and asking them to place imaginary data points on the graph.

Two rows of bar graphs drawn by subjects. Top row: Data points are centered around bar tip. Bottom row: Data points are between X axis and bar tip.

“But,” you might say, “is this just a mistake people make because they don’t understand averages?”

Nope.

Graph of percentage of readouts that made the bar tip limit error. “All”: full dataset. “Correctly defined average/mean”: participants who correctly defined the mean. “Correctly identified average/mean”: participants who correctly identified a mean value on the same graph that produced the readout. “Correctly defined & identified average/mean”: participants who both correctly defined the mean and correctly identified a mean value on the graph. In all cases, the proportion of bar tip limit errors is about one in five. Vertical lines show 95% CIs, and gray regions show full probability distributions for the uncertainty around the percentage values.

Kerns and Wilmer show that even when people can define what an average is (second from left in graph above)...

And even when people can identify the average on the graph (third from left above)...

And even when people can do both (rightmost in graph above)...

About 20% of people still make the mistake of placing all the data points below the bar tip.

“But,” you might say, “maybe people with more advanced training would not make this mistake? At an academic conference, most of the people are in or have gone to graduate school.”

Nope – well, mostly nope. General education alone doesn’t seem to make much difference, but specific education might.

Scatterplot. X axis: Education level, grouped into high school, some university education, university education, and graduate education. Mean bar tip limit measures for each participant plotted against general education level, where high values indicate subject made bar tip limit error. Black line: least-squares regression line. All four categories show a persistent minority make the bar tip limit error.


In the graph above, high values near 100 show a subject made bar-tip limit error. All four groups show a persistent minority – again, about one in five – make the bar-tip limit error.

But lest you think this is some sort of “hard wired” cognitive bias for some people, mistakes do seem to decline as people received more formal training in statistics.

Scatterplot. X axis: Statistics training, grouped into none, less than 1 course, one course, and more than one course. Y axis: Mean bar tip limit measures for each participant plotted against general education level, where high values indicate subject made bar tip limit error. Black line: least-squares regression line. All four categories show some individuals make the bar tip limit error, but fewer make the error if they have more statistics courses.

Nevertheless, even with multiple courses in statistics, some people continue to make the bar-tip limit error.

This might explain why there are so many people who continually complain about “Half the country is below average!” Hat tip to Darach Ó Séaghdha on Twitter for spotting this example:

Headline rading, "Several counties still have a higher virus incudence rate than the national average"

It is worth creating bar graphs with the knowledge that some people won’t read the graph correctly. Twenty percent is a lot of viewers. For comparison, think about the attention designing for colour blindness gets, even though probably less than 5% of people at a typical conference are colour blind.

On a poster, I worry about the level of visual complexity inherent in graphs where the major point is to show differences in averages. I say again: summarizing data is powerful. But I see the value in helping readers avoid falling into the bar-tip limit error.

I suggest that your bar graphs of averages use colour to emphasize the bar, so that it is visible at a distance, and use low contrast to show the individual data points. (See this post on putting make-up on your graphs.)

This is the scenario tested by Kerns and Wilmer:

Generic bar graph wth three bars.

As far as I can tell, Kerns and Wilmer did not test the effect of adding any sort of error bars to the graph, like standard deviation or confidence interval. So maybe that would help avoid the error:

Generic bar graph wth three bars with error bars.

But maybe the best way to break the bar-tip limit error is just to add the data.

Generic bar graph wth three bars with error bars and data points.

But this is now getting visually complex. The colours used to fill the bar above are a little intense. Large areas of colour still read as a colour, so those are a bit more subdued.

Generic bar graph wth three bars with error bars and data points, but data points are low contrast..

The data points are a neutral – light grey – and have a 50% transparency. The data are visible, but hopefully not too distracting from a distance. This particular graph above may not be perfect in terms of the right balance of contrast and colours, but indicated what I think is a good approach.

References

Kerns SH, Wilmer JB. 2021. Two graphs walk into a bar: Readout-based measurement reveals the Bar-Tip Limit error, a common, categorical misinterpretation of mean bar graphs. Journal of Vision 21(12): 17. https://doi.org/10.1167/jov.21.12.17

Related posts

Never use a graph you can’t explain

Lessons from make-up

External links

Can you read a bar graph? (NPR Science Friday)

05 May 2022

Using artificial intelligence to create posters

Back in February, a presentation at Association for the Advancement of Artificial Intelligence conference proposed “PosterBot”: an artificial intelligence (AI) for making conference posters. 

The authors, Xu and Wan, pitch automated poster making as a way to “save time.” They do this in three steps.

(W)e propose an automatic poster generation system which takes three steps, namely section filtering, content extraction, and poster composition.

First, they use an existing natural language AI to analyze the text.

Then, they analyze the figure captions to extract more text to determine where figure belong. They use the captions because the images are too abstract for AI to categorize.

Finally, they stick the extracted content into one of several pre-defined templates. They have both landscape and portrait formats. Here’s an example of a poster generated using the bot.

Example of a poster created with PosterBot.

It might not win a competition for attractiveness, but it’s hardly the worst thing ever to hang in a poster session, either.

If I understand correctly, they treat poster creation as a matter of data compression. You have a whole bunch of text and figures, and the problem is cutting it down to the essentials. It’s true that many poster creators do put too much stuff of a poster.

So for PosterBot to work at all – never mind it bringing gains in efficiency – the entire project has to be already written up. Complete text. The whole enchilada.

In my experience, this is rarely the case. Posters are often the first time that people are bringing a project together. There is no text for an AI to select the best bits from because there is no text at all.

As they say on Shark Tank:

Mark Cuban saying, "For that reason, I'm out."

 “For that reason, I’m out.’

PosterBot may be interesting to AI researchers, but it seems unlikely to be helpful to rank and file poster makers.

• • • • •

I had written everything above and had scheduled this post when, coincidentally, I stumbled across another paper that was trying to generate posters automatically (Jin et al. 2022). This one is called Text2Poster.

FLowchart showing Tet2Poster process with example of a poster generated using this method on right.

Text2Poster differs from PosterBot. PosterBot is specifically trying to create academic posters. Text2Poster is trying to generate posters for a wider range of purposes.

But both share the same general process: creating a poster by extracting information from a relatively complete set of text. For a typical poster maker, that is not going to be there. 

Both projects are fascinating from an artificial intelligence perspective of “What can we make software do?”, but they are unlikely to be helpful to most conference poster creators.

• • • • •

And I had written everything above when I stumbled across a third paper (Lopes et al. 2022) about using artificial intelligence to design things. one is the furthers afield from academic conference posters.

EvoDesigner uses an “evolutionary” approach to spit out a series of suggestions that a human designer can work with. The works are measured by their “fitness,” and sent directly to Adobe InDesign.

Ten samples of graphic designs generated by EvoDesigner.

This one is less relevant, but more interesting for a couple of reasons. One is that it “talks” directly with Adobe software, which is the existing industry standard for many. Second, it is a tool for idea generation, not final production creation.

That I stumbled across this series of papers in a matter of a couple of weeks shows that this is clearly going to be creating more options for conference poster creators going forward.

External links

Jin C, Xu H, Song R, Lu Z. 2022. Text2Poster: Laying out stylized texts on retrieved images. ICASSP 2022 - 2022 IEEE International Conference on Acoustics, Speech and Signal Processing (ICASSP). https://doi.org/10.1109/ICASSP43922.2022.9747465

Lopes D, Corriea J, Machado P. 2022. EvoDesigner: Towards aiding creativity in graphic design. Presented at Artificial Intelligence in Music, Sound, Art and Design – 11th International Conference, EvoMUSART 2022, Held as Part of EvoStar 2022, Madrid, Spain, April 20-22, 2022, Proceedings, 2022, pp. 162-178. http://dx.doi.org/10.1007/978-3-031-03789-4_11

Xu S, Wan X. 2022. PosterBot: A system for generating posters of scientific papers with neural models. https://www.aaai.org/AAAI22Papers/DEMO-00141-XuS.pdf (PDF)

04 May 2022

Academic conferences need "Codes of Public Health"

2020 was a year of conference cancellations.

2021 was a year of online conferences.

What will the 2022 conference season be like? I’m not sure.

On the Better Posters Twitter account, I have been tweeting people’s reactions to the prospect of the return of academic conferences in person. And people’s feelings are... all over the place. 

On the one hand, I see people’s pent up desire to get to meet their colleagues again. This is consistent with reports I’ve seen that air travel volume is at an all time high. People want to get out. Some people are gushing about how the face-to-face interaction is so much more productive and inspiring than video calls. Rebekah Rogers tweeted:

In person conferences are like a breath of fresh air. New ideas and collaborations from incidental discussions. New colleagues with different perspectives.

There's just no match for that community in the online world. Hoping we can keep it going for years to come.

On the other hand, some people are freaking terrified. The COVID-19 pandemic is far from over. It’s now clear than about one in twenty people who get COVID-19 get symptomatic long covid, It’s debilitating and we don’t know how many people will recover or when. Long covid is not something you want to screw around with.

While this tweet isn’t about academic conferences, I think this sentiment from Chelle P. holds for academic conferences:

Hearing about an SF/F con where folks tested + for COVID and still blithely attended panels and meals really continues to hammer home that people like me aren't going to be able to participate in events again anytime soon. Because other humans just cannot fucking be trusted.

People who have kids who can’t be vaccinated, people who are immune compromised, are feeling left out and upset that conferences are going to push back to face-to-face with no consideration for them. Sebs Echeverri tweeted:

Super cool to see lots of conferences rolling virtual attendance back to a stream of the keynotes and maybe some plenaries, with limited or no ability to present research.

Totally excellent that academia has doubled down on punishing poor / disabled / immunocompromised scientists.

As if to exemplify this, Katie Greifeld tweeted that she had COVID-19 a mere four days after tweeting that she loved conferences.

And on top of that, there are a bunch of people who have found that online conferences have big advantages. They enjoyed the greater flexibility and accessibility and (often) lower costs. When you taste success, the tongue wants more.

Christopher Neugebauer is on to a really important idea: a public health code for conferences.

Public health policies are just as important a tool for in-person conferences as codes of conduct. They're a contract with the community that organisers are making to provide a safe place to gather.

I hope the community starts treating these as non-optional, just as for CoCs.

In the last decade, academic societies and conference organizers realized the importance of having a conference code of conduct. It was important for them to take public positions against bullying and harassment.

It’s shaping up to be a very fraught, complex, and conflicted year for academic conferences.

Update, 11 May 2022: Katie Mack’s summary of conference season 2022:

Conference hashtag during conference: Talks, updates, photos

Conference hashtag after conference: Rapid test pics, symptom updates, contact tracing

03 May 2022

Lecture Breakers #121

Lecture Breakers logo
I’m on the Lecture Breakers podcast this week!

I saw host Barbi Honeycutt on a YouTube video, and heard about her work with teaching in alternative formats besides lectures. I reached out to see if she was interested in chatting about using posters for teaching without realizing she had already a great blog post on the topic herself.

I had a blast talking with Dr. Honeycutt, and I hope the fun comes through on the show.

In preparing for the interview, I listened to a few episodes of the podcast, and I am now a regular listeners. If you are an educator, do yourself a favour and subscribe to this podcast. The enthusiasm is high, the questions are smart, and the guests are thoughtful educators. It’s a great listen for anyone teaching in higher education.

Related posts

Using poster assignments in courses

External links

Lecture Breakers #121

6 Ways to Use Teaching Posters in Your Course to Increase Student Engagement (2019)