Showing posts with label QR codes. Show all posts

20 May 2025

QR codes on conference posters: Some scan, some don’t

I have been writing about the possible uses of QR codes for more than a decade now. But I have had one lingering question.

Does anyone actually use them?

This matters for conference poster design, because every bit of space on a poster matters. If nobody is scanning QR codes on posters, they should just be left off. 

I looked through Google Scholar many times trying to find any research on how often QR codes get scanned. And I keep getting nothing. Obviously, companies that use QR codes can track how many people visit a website or download something that a QR code leads to, but those seem to be purely internal data that never get shared.

My completely subjective impression was that QR codes were not used by viewers. I rarely saw anyone with their phone out, scanning QR codes, when I walked through poster sessions.

If I had to guess how many poster session viewers scanned QR codes, I would have guessed it would be a percentage in single digits. Maybe 10% at best.

I was wrong.

Last week, I was at the ISMPP conference last week presenting a poster that tried to answer this question. Click to enlarge!

Poster with main message, "Prominent QR codes that clearly say what they lead to may enhance engagement"

The top line result was shocking to me. About half of conference goers surveyed scanned QR codes! That was far more than I expected!

Now, this may be an unusual audience. Medical communication professionals may be more technically savvy than attendees at other conferences. Similar studies at other conference would be welcome!

Although engagement was higher than I expected, the reasons why people did not scan the codes were interesting. Many just didn’t notice them. So if you people to scan your QR code, maybe don’t make it the size of a postage stamp and stick in at the bottom of your poster.

Another reason that people didn’t scan QR codes may not be fixable, the dreaded “Not interested” response. 

But when I presented this poster, I noticed that a poster nearby had a QR code with the description:

Scan to discover more.

As a viewer, I was wondering, “More what?”

What is the value add that I get from scanning this QR code? If you told me what is on the other end of that QR code, maybe I will be interested enough to fish out my phone and scan it.

And the moral of the story is: QR codes are not wasted space on a poster if you feature them in smart ways.

A note about the design of this poster. I did not design this poster; it was done by professionals who work with my colleagues at IPG Health. We tried to exemplify two of our own recommendations by making the QR code big and telling people exactly what they get from scanning.

Reference

Messina EL, Faulkes Z, Evans V, Wells JL, Morrison M, Parrish C, Hannan N. 2025. Half of Cochrane and ISMPP conference attendees scan poster QR codes: Can we harmonize discordant feedback to further enhance engagement? Poster presented at 21st Annual Meeting of International Society of Medical Publication Professionals (ISMPP), Washington, DC, USA, 12 May 2025. https://cdn.fs.pathlms.com/bSpeakR8RpO1BjN63xkx?cache=false&dl=true (PDF); https://mhmc.reveal-sp.com/poster/view/?id=UQj901Y1U (video walkthrough)

Related posts

Posts tagged with QR codes

17 November 2022

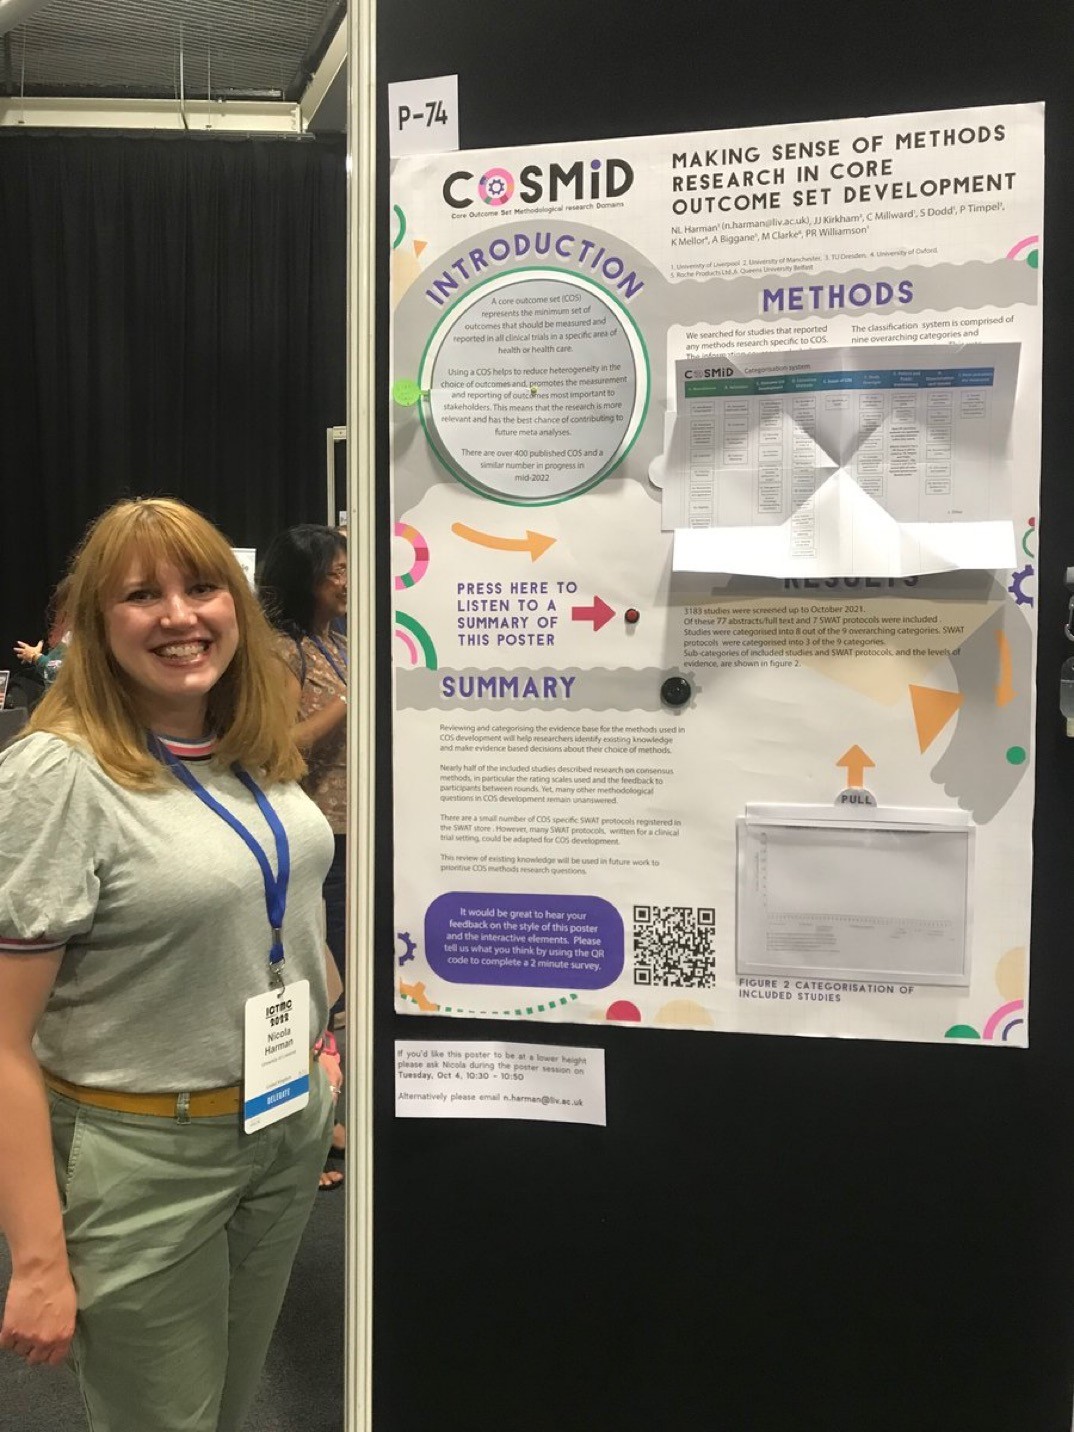
An interactive poster with sound and paper magic: Q & A with Nicola Harman

Nicola Harman recently tweeted a short video of a poster that invited the viewer to reach out and touch it.

“This year my poster is interactive and has a voice recording of the poster walk through.” Take a look:

I reached out to Nicola for more information, and she graciously took the time to answer some questions (lightly edited).

• • • • •
Nicole Harman presenting her poster.Q: What has your conference and poster session experience before this meeting?

A: I’ve presented both oral and poster presentations at national and international conferences. I also won a poster prize back in 2008 just after finishing my PhD. Although I’ve been to a few conferences now I’m always revisiting how best to share information and this extends to my current research in clinical trials methodology too.

Q: The recorded tour was something I’ve never seen done before. What was the inspiration and how did you do it?

A: I think accessibility of information is really important. A typical poster relies on someone reading the information, but offering an audio description opened the poster content up to people who preferred to listen or found listening easier. It also meant that someone could listen even if I wasn’t at the poster at the time.

I kept the recording to just under 2 minutes assuming that’s about as long as someone has to spend with each poster. 

The kit I used was an mp3 chip from a UK company called Talking Products, it costs around £12, is really easy to use and can hold a 4 megabyte file (about 4 minutes of playback). You could also use an mp3 module with a microcontroller like an Arduino or Raspberry Pi if you wanted a longer recording.

Q: Can you tell me about the inspiration for the papercraft and how you created it?

Cover to "Paper Magic" by Harry Houdini
A: I really enjoy making stuff and paper is a great medium to work with. I’ve been reading Harry Houdini’s book Paper Magic and felt inspired by how simple paper folds and cuts could create a sense of wonder and excitement. I thought it would be interesting to see how this might work on a poster and what sorts of paper methods I could use. I essentially wanted things that created excitement, made things easier to read, and were a little bit magic.

I used three different techniques on the poster:

The Introduction section had a circular reveal. I hoped that this would have the exciting magic element and also make things easier to read as I could maintain a good font size by essentially doubling the space available.

The Methods section used a Turkish map fold to share a categorization system. Again, this method meant that I could have extra space and make the table much larger.

The Results section used an acetate reveal (I’m not sure if that’s actually what it’s called!). Essentially, the results table was layered so that the graph was empty until you pulled it up to reveal the content. I think this was mostly magic!

I designed the poster to scale in Adobe Illustrator, printed components using a Canon ip8750 that could print at A3, cut some elements using a Silhouette portrait and then printed the main poster at A0 using the university printing services.

Everything was mounted on a foam core board so that I could embed the speaker and mp3 chip together with some magnets that helped keep the Turkish map table open and hold up the Results tab.

Q: Interactive features could fray or fail with repeated use. The video makes it seem that the “voice tour” button was a bit hard to press because the board wobbled. How long did the poster session run for, and how well did the poster hold up?

A: The poster was available to view over two and a half days. It was in the same room as the coffee breaks so typically had the most footfall then. I was worried about the paper elements too, so tested a few out before finalizing the design. 

One technique that I loved was a woven paper reveal but that wasn’t going to hold up over the conference, so I put it to one side. 

Overall the poster held up really well, the circular reveal was the bit that needed a little bit of repair afterwards but if constructed a little differently this shouldn’t be a problem. The other two elements were fine and didn’t need any repair afterwards.

The battery pack did mean that the poster wasn’t flush to the board so I’d probably re-think its positioning next time. There was also a tiny delay in the audio file starting after pressing the button which is why my colleague pressed it again, the third time was to switch it off.

Q. I tried to see the survey, but it was closed. What was on the survey?

A: I’m a trials methodologist so I was keen to evaluate the methods used in the poster. I used a QR code to link to an online survey that had twelve short questions with a five point Likert scale response. The questions were grouped into two main categories:

Questions about the poster design: For example, did the interactive elements help to highlight information? Did you enjoy engaging with the elements? Did the interactive components motivate you to talk to colleagues about the poster?

Questions about the content: Was the content easy to understand? Did it flow well? Did the interactive elements help you to remember the content/key messages?

Q: How many people clicked on the QR code and did the survey?

A: There were fifteen responses to the QR code survey which was quite a low response rate taking into account the conference size and the number of people that I spoke to. It was still valuable information though and the response rate has also given me a few things to think about in terms of methods to collect feedback in this sort of busy environment, especially when competing with coffee, pastries and chatting to friends!

Vistors to Nicole Harman's COSMID conference poster.
Q: What was the audience reaction like on the poster session floor?

A: The audience reaction was great, lots of people engaged with the poster and then told their colleagues about it so they could try it out too. It created a really fun atmosphere. Reflecting on it personally I engaged with more people than ever at a poster session/conference. It helped to establish a two way dialogue with others, including those who’s research area was very different to my own, so was a great way to share my research, learn about others research and make new connections.

Q: Your tweet got thousands of likes and the video in it was viewed tens of thousands of times. Did you expect that much of a reaction? Was that online response been similar to the face-to-face response?

A: I did not expect that reaction to the tweet. If I had known I might have spent a little more time on the video! It was fantastic to get such a positive reaction both online and face-to-face and I feel inspired to take this further and think about academic applications beyond poster presentations. I’m currently working on a zine about it to summarize what I did but also share some more inspiration and resources. 

• • • • • 

Thanks again to Nicola for sharing your experience and for daring to be different!

Book cover from here. 

External links

Turkish map fold with a square sheet of paper

Houdini’s Paper Magic summary 

29 October 2020

Link round-up for October, 2020

The 29th International Conference on Neutrino Physics and Astrophysics poster session looked like it came from Second Life:

Virtual poster session

Apparently nobody has heard that Second Life is a very niche community these days. Some people just can not let go of the notion of virtual spaces. 

But the organizers were happy with the outcome:

Del Tutto says the poster session was “absolutely a success.” But in the moment, it was a risky choice. Organizers, including Del Tutto himself, were “skeptical” that the VR format would work, he says. To improve its chances, Del Tutto ran a beta version for a couple dozen users about a week before the conference. Had it gone badly, they had a backup plan to run the poster session on Zoom.

The virtual format made discussion for some attendees much easier. Because the avatars’ appearances were devoid of race or gender, some expressed that they found it easier to meet and talk to new people, says Del Tutto.


• • • • •

Did you know there are fonts specifically meant for titles? Below is the same font (Perpetua) in its regular weight (black) and titling weight (white).


Perpetua Titling and regular Perpetua at the same point size.

MyFonts continues dispensing typographic wisdom in another one of the occasional primers. They write:

(Titling fonts) were specifically designed to look best in predominantly larger sizes. Titling fonts often have a more pronounced weight contrast, tighter spacing, and more condensed proportions than their text-sized cousins.

PDF here.

• • • • •

A few months back, The Word Lab featured a session on conference posters. You can now download the slides here. 

• • • • •

PosterPresentationLabs is a commercial design service for conference posters. Their website says they have been making conference posters for scientists since 2008, although their Instagram account started late September.

Their work looks good, although text heavy. That may be the fault of the researcher and not the designer, however.

• • • • •

The business of scientific conferences may never, ever be the same. This article in The Scientist examines the stresses that have been building on conferences for a long time, notably the carbon costs of conferences.

And people like a lot of the convenience of meetings on screens.

• • • • •

Given what appears to be the imminent death – or at least irrevocable change – of conferences, Laura Helmuth pulled a quote from this Scientific American article.

“The two scientists began collaborating in 2011, after meeting at a conference in Puerto Rico where they went to a café and talked about the overlap in their work.” Who else has started a collaboration during a conference break? I miss that part!

Andy Revkin responded:

Great observation/question - and relates to what is missing in conventional zoom-a-thons. Space to chill and explore. Anyone out there doing zoom walk-and-talk breakouts via phone? Anything sustaining this capacity? I'll do a #sustainwhat #thrivingonline episode on your ideas.

Similarly, in an unrelated thread, Guillaume Lobet wrote:

What I am missing is the interaction with colleagues over a cup of bad coffee and cheap biscuits. Interactions and networking have always been a big part of conferences for me. This is the part I miss the most! (I do not care much for fancy locations and nice hotels)

Lobet suggests a hybrid format that combines the physical meeting (for some) and recorded content (for many.

• • • • •

The Scientist article above also links out to an article co-authored by Mike Morrison (he of the billboard style poster) about boosting the impact of conferences.


The article’s bottom line: Everything in a scientific conference should be easily viewable online for free.

• • • • •

Justin Joque spotted a headstone with a QR code linking to the deceased list of papers and citation metrics.

Gravestone with QR codes obscured for anonymization.

Published and published and still perished.

• • • • •

Update, 30 October 2020: Normally, I don’t add entries to month link round-ups. Anything that I miss normally just goes into the next month’s compilation. But this New York Times article on US election maps is too timely to wait until the last week of November. 

Close-up of US election map in red and blue demonstrating how colours "pop" because of stereopsis.

Great discussion about how visualizations can deeply misrepresent reality, while purporting to be “objective.”

Also shows how unfortunate it is that political parties used bright primary colours for their branding.

Hat tip to Bethany Brookshire.

24 September 2020

Link round-up for September, 2020

SciMobi is a new service for delivering poster-like content online. (I say poster like, because if it’s not on paper, is really it a poster?) Phil Greenhalgh has a pair of posts relevant to our interests here at LinkedIn. 

The first is on QR codes. It arrives at the same conlusion of some earlier posts on this blog (always say what they lead to!).

The second is partly about the billboard poster format that has been the subject of much discussion. It uses a nice metaphor of catching. Throw one ball and someone can probably catch it. Throw a lot, and they will drop them. Excerpt:

Alas, when working in some of the most highly regulated industries in the world, the luxury of brevity isn't always one we can afford. The amount of balls is sometimes beyond our control, we are compelled to become jugglers. If the content just positively has to be there, it becomes our job to not throw the balls all at once at our audience, but to hand them safely one-by-one so they are not dropped.

Scimobi will soon have a 15% discount for Better Posters readers! I will announce it on the Better Posters Twitter when it’s ready. Thanks to SciMobi!

Update: The SciMobi discount code is:

betterposter15

It is good for three months (i.e., until mid December 2020).

• • • • •

Echo Rivera scored a coup with this awesome guest post from Heather Hinam. Heather makes posters for a living - only she knows them as “interpretive signs” for public displays like parks and museums and the like.

Bees and pollinators interpretive sign

Heather provides a breakdown of her process of making these rich, complex signs. I like this tip: write your text last!

Now that everything is where I want it to be, I finally start writing the text. I know some of you reading this will find it counter-intuitive, but by doing it this way, I never end up with too much copy. I can only fill the space that I have created.

While the target audience is general rather than academic, many academics would do well to look more at these sorts of signs as inspiration!

• • • • •

Florence Nightengale, she of nursing fame, was also a dataviz nerd.

Diagram of the causes of mortality in the armies in the east

Hat tip to Emily Anthes.

• • • • •

What art can do for science. Hint: way more than public engagement. How about:

  1. Change your perspective.
  2. Use data to create art and vice versa.
  3. Create new visual metaphors.
  4. Broaden frames of reference.
  5. Get inspired!

At Lifeology.

• • • • •

Kris Faraldo describes how to use PowerPoint make graphics fast with minimal graphics skills. (PowerPoint really is good for quick and dirty images.)

• • • • •

I am a big fan of actor Natalie Morales. Near the end of August, she dished some personal experienced with typography on Instagram.

The fact that people on here have the option to use Comic Sans is very upsetting to me

I'm dyslexic and I've heard Comic Sans is good for dyslexics but all it produces in me is pure rage. There are much better ones.

 As far as I am concerned, her word is law.

• • • • •

The first graphic novel created in India, The River of Stories, was recently reprinted. It’s a story of indigenous people, economic development, journalism, and more.

"The River of Stories" cover

The River of Stories is (mostly) English, and you can view it here (part 1) and here (part 2).

• • • • •

All for now!

28 March 2019

Link round-up for March, 2019

Mike Morrison has a 20 minute video describing what a poster session is and how to make a poster.


Unlike Mike, however, I do not believe poster sessions are “holding the human race back in a non insignificant way.” The video, particularly the first half, is pessimistic about poster sessions. Around 13:25, good stuff starts to happen as Mike outlines a good poster design. I think he overestimates people’s willingness to snap pictures of QR codes, though.

Mike has provided templates here, and is working on a study validating the design he has. He is looking for grad students to participate. You can email him at Mike.A.Morrison@gmail.com.

Amy Burgain saw this video and offers this alternative:


Amy writes:

It achieves the clear simple message BUT emphasizes how that message is supported by the DATA. It keeps the goal of understanding how the conclusion is related to the data while also making it easier to glean main messages.

I plan to have my own longer post about this in a couple of weeks.

Hat tip to Chris McTeague.

• • • • •

Dan Raboksy talks about the difficulty of working in poster sessions with hearing issues.

I have profound hearing loss and struggle in many conf situations. Plenary talks in ballrooms: usually bad to impossible. Poster sessions: terrible.

Dan notes that someplace with background noise, like a poster session, makes it almost impossible to understand speech. Off the top of my head, I think there are a few things that organizer can do to help:

  1. Have posters go up and stay up when no poster presentations are scheduled, so people can view posters in a more quiet surroundings.
  2. Ensure there are “quiet rooms” where someone can go to. Some people just like to have “chill out” rooms, but these could double for quiet conversations. (Science Online used to have these.)
  3. Make posters available online before the poster session. (This idea from Goring et al., 2018.)

• • • • •


BBC journalists have written an explainer on how they generate their graphs in support of news. They are using R’s ggplot2 package and putting out some nice stuff.

ggplot2 gives you far more control and creativity than a chart tool and allows you to go beyond a limited number of graphics. Working with scripts saves a huge amount of time and effort, in particular when working with data that needs updating regularly, with reproducibility a key requirement of our workflow.

The team has generously shared what they have learned by putting out a reference “cookbook” for making graphs and a package to generate the BBC’s house style.

Personal opinion: I’m glad it works for them, but I am never going back to command line.

• • • • •

Morgan Carter suggests a way to integrate posters and preprints:

(I)f you are making a conference poster about work from a recent preprint, throw the QR code at the beginning or end to invite folks to “read the full story”. I did it at a major conference last year, and I got questions about #biorXiv and preprint posting.

BiorXiv has a built in QR code generator. Hat tip to Tim Stearns.

• • • • •

Stacy Keith has a useful infographic to budgeting time for making anything, including posters.


• • • • •

Bryan Gaensler has a useful Twitter thread on how to deal with the stress of conferences. For example:

Look through the attendee list in advance. If there’s someone coming who you know and trust, ask them beforehand to check in with you during the meeting to see if you’re OK, or to introduce you to the people they’re talking to

Many more tips in the thread.

• • • • •

Speaking of tricks, here is a list of ten tips for making text more readable by Igor Ovsyannykov. A couple of years old, but new to me.

• • • • •

LeeAnn Tan has a wonderful gallery of her poster work at PosterFolk.com. I hope to have more from LeeAnn in the weeks to come!

What seems obvious to you may not seem obvious to a new conference goer. Jesiqua Rapley wrote:

My first conference was an international conference in another country in the first year of my MA. I was alone, incredibly introverted, and terrified. I had NO idea what I was supposed to do. I didnt even know how to properly hang my poster.

Supervisors, don’t do this to students. Don’t leave them hanging. Either go with them or do extensive briefing beforehand.

03 May 2018

Critique: Generic python

Today’s poster is from Leonardo Uieda. This was presented at the American Geophysical Union fall meeting last year. Click to enlarge!

A modern Python interface for generic mapping tools

Leonardo explains:

It’s about a software project I’m working on and not really about research results. That’s why it has no results figures (though the background of the poster was generated by the first code block on the right, so it serves as a kind of result).

The message I was trying to get across is: “We’re building this thing. This is what we currently have. Come help us!”

It’s always tough to have a poster that is just text. I might have tried to bring some element of the map off the background and somewhere into the foreground. The subtlety of the background enhances the legibility of the text, but at a glance, I can’t see anything that says, “maps.”

Leonardo continues:

I expect that my main talking points during the presentation will be around the code. Each line was put there so that it would represent an idea in our design and why we think it’s a good choice. The online demo and websites have a lot more information for people to read.

Colour coding the text in the code block is another nice touch that adds to the visual interest of the poster. I have no idea if the colour highlight consistent elements of the code, but that would be the principle to look for.

Finally, Leonardo says:

After printing, I realized that I should have made the margins wider, particularly between the two halves of the poster.

I agree with Leonardo that a bit more white space between the halves would be a good idea. But luckily, the text on the two sides only approach each other at about two points, so this is not a horrible problem.

There are two QR codes. Leonardo is good enough to give brief descriptions of what they are, which is excellent. I might want a little more detail about what the demo consists of, though. Can I run it on my phone? Is it interactive? Is it a video?

This poster shows a lot of good decisions. I just wonder if there are enough people browsing during the conference who would recognize and care about “Python” or “Generic Mapping Tools” to come and chat.

External links

Poster: A modern Python interface for the Generic Mapping Tools

19 October 2017

Critique and makeover: Bird sperm

Today’s poster is a contribution from Antje Girndt, who presented this at the European Society of Evolutionary Biology (ESEB) 2017 meeting in Groningen, the Netherlands. Click to enlarge!


Antje was kind enough to write her own analysis of this poster:

It uses a Dutch colour theme and comes with little text. The introduction is pushed to the bottom and I am almost not explaining the methods. QR codes link to my profile and the accompanying data and script at the Open Science Framework. ...

I like my final product but at the same time, I am not fully satisfied. The lower bit with the bullets, affiliations and references somehow bugs me, but I cannot pinpoint why.

Antje’s approach is very much in line with the style I have been moving towards lately: make a simple, big statement up top. I think it could have been an even stronger title if the title said “why it matters.” Maybe something like “Sampling methods affect bird sperm data” or “Bird sperm should only be collected with one method.”

Despite the title being large, it feels less prominent than it should be because the colours are so muted. The authors are jumping out, when the title should be. I would have flipped the colours of the title and authors: used dark text for the authors, and white text for the main text. The shadowing on the title is not helping the cause, either, because it is reducing the contrast between the text and background.

I would also have put a little space between each graphic element; the two pictures and the graph. The two pictures, in particular, don’t clearly separate out visually.

Maybe Antje’s concern about the bottom half of the poster springs from a couple of things. I think each element  needed more vertical space between them. It also seemed to me that the “Future studies” statement was a stronger as a concluding sentence. The placement of the QR codes breaks the logical flow of the text.

Here is a quick revision that tries to address those issues:


It has more punch from a distance and flows better.

There are a few other things that I might change that I didn’t put in the revision above. The key graph on the right is a little tricky to interpret. I think each line is an individual. The mean is highlighted, but the difference between the average and the raw data could be enhanced even a title more. There is a lot of white on either side of the data.

The typeface is a handwritten script that is attractive, but is all capitals. This might make it a little harder to read.

The institutional affiliations are listed in footnotes at the bottom. I’m unsure about this. On the one hand, affiliations are the sort of disposable information that footnotes are made for. On the other, if you are going to list affiliations, it makes sense to put them at the point of need. It’s also weird that institutional affiliations come between the references about sperm. The references are incomplete, too. No volume or page numbers.

The QR codes do not follow a good practice: there is no description of what I get if I scan them. There is plenty of white space around them, so it would have been easy to include a description of what each is.

If you want to compare the poster to the final paper, the published paper is here.

10 December 2015

The next big thing... or dead thing?

Lots of poster presentations would benefit from having something that’s hard to show on a static, flat piece of paper. The question becomes how to bring in other elements, like video. People have tried a lot of hacks, several of which I’ve described in this blog. The latest contender? Near field communication (NFC) chips.

Biochem Belle pointed me towards NFC technology, which this article says are meant to pick up where QR codes left off. Basically, NFC chips are a quicklink to the web, like QR codes. The difference is that instead of scanning a code with a phone camera, you tap your phone to a spot.

Belle asked if this could be something used on posters. My gut reaction: no. Or at least, not yet. It’s too new and unfamiliar, not transparent, and takes too much work on the part of the recipient. And what percent of phones are NFC enabled? This 2011 article suggested slightly more than half of phones would have NFC by this year. But I can only find predictions, not actual numbers for right now.

We’ve seen how QR codes are used. A few people using them on posters, but they never really took off as an enhancement to posters. NFC chips don’t seem to solve any of the issues QR codes did.

Having thought about this for a few years now, I think that the digital future of poster presentations is not in things that let you link to other sources, but in lots of big, cheap screens.

30 July 2015

Link roundup for July 2015

This month’s must read is from Bethany Brookshire, a.k.a. the mighty Scicurious, who has been baking cookies for science. She is at the point where she is making posters showing the results of her experiment.


Her article is aimed at people who are still in school, but is worth reading even if you haven’t used glue sticks in a while. For instance, Bethany writes:
What makes a good poster stand out is one having what I call the three C’s.

  • Continuity: The poster should present a continuous story of your experiment. ...
  • Clarity: When you share your research with others, you want to make sure that what you did is clear. ...
  • Consistency: The style of a poster should be consistent to help the poster look clear.

Today’s lesson in why the spacebar was invented: to prevent the University of Florida art education department from embarrassing itself (hat tip to Jeff):


Default QR codes are kind of ugly. But here’s a way to make them more interesting. You can upload a small, high contrast image, and incorporate that into the code at this website. Fer instance, I took this UTRGV institutional logo:


And turned it into this QR code that links to the university home page.


If you squint a bit, you can kind of make out the shape of Texas! I could probably do better if I made a black and white image. Hat tip to Dustin Mayfield Jones.

While everyone is abuzz with the gorgeous images of the Pluto flyby, take a look at how the first television image of Mars was made fifty years ago this week. It’s a story of impatience and a lot of crayons. (Okay, pastels.) It’s a fascinating story of turning data into an image. Hat tip to many, including Sarcastic Rover.


“How big should the text be?” is a persistent, but not readily answered, question of poster designers. But there is a particular kind of poster where text size and visibility has to be rigorously assessed: eye charts. This article is an in-depth look at how eye charts were designed and have changed over time. Hat tip to Mocost.


Here’s one for conference organizers: how to make your meeting accessible to people who are ill or have long term disabilities. Another contribution: make sure chairs are available somewhere for the poster session for people who have trouble standing for long periods.

Album covers become iconic images. Album covers were some of the first things I thought about in design terms. One of my favourite cover designers was Malcolm Garrett, whose name appeared on records by many early 80s UK bands. Songwriter and business woman Little Boots talks about the creation of her latest album cover:


The more you learn about design, the more good descriptions of process become invaluable.

Follow this Twitter thread for some interesting comments on what people look for in a poster.

And I’m going to leave Andrew Farke with the last word this month:

All together now: Posters are often a better presentation medium than talks! For both presenter and viewer! Seriously! #2015SVP

29 January 2015

Link roundup for January 2015

A poster using augmented reality, courtesy of creator Stuart Eve.


Stuart writes:

I am of course not the first person to use AR in a poster, but I am sure that it will become a lot more popular as it really is an excellent way of adding content to a poster, without being too intrusive. I guess at the moment it could be seen as being a little gimmicky, however this isn’t all that bad when trying to attract people to your poster and your research. One of the important things to remember though is that the poster needs to be able to stand on it’s own without the AR content, as it is quite an ask at the moment to get people to download an app on their phone just to learn more about your research.

The Biophysical Society has a short post on how to prepare for a poster presentation.


Katie Mack reminded us of poster etiquette (my emphasis)

Escalator policy is: Stand on right, let people rush past to catch sessions/etc on left. No clotheslining with poster tubes.

Not everyone agreed.

Isn’t that the whole reason for making posters??? - Michael Jewell

That and cardboard tube sword fights. – Matthew Buckley

Jon Tennant notes ORCID offers a new service:

Just ordered some ORCID QR code stickers - snazzy and useful! Can put on poster presentations, etc.

The problem of too many logos on posters, revisited by Kim Martini. The solution:


While the title of this post is 7 tips for women at conferences, the ideas within are helpful regardless of your gender. Hat tip to Ivan Oransky.

While few people want to be jackasses, sometimes, we forget and end up being jackasses. Stacey Patton reminds us how not be be a jackass at a conference. Perhaps most relevant to poster sessions is this tip:

Once it has served its purpose, don’t stare at the name badge.

Paul Armstrong provides a reminder of why you need to align things by eye sometimes. The responses to his original tweet are worth reading, too.


Shit Academics Say contributes this bit of poster philosophy:

A. There is nothing new under the sun.
B. Sure, but at least change the poster title.
A. Fine.

25 April 2013

Link roundup for April 2013

Hat tip to Matt Thompson for spotting this comic:


An interview with Amanda Cox on data visualization. Cox is the graphics designer for the New York Times, which has a reputation for fine graphics. Lots of very interesting ideas here. For instance:

The ability to ask good questions is really what we start with. I come from a statistics background, and I’m finding statistics students’ portfolios are crazy weak compared to the computer science students, even though they’re playing with the same problems. I think it’s because comp sci students are encouraged to play, whereas stats majors it’s, “here’s your rule book, now make things.”

Don’t do this. Logo fails. Each one makes an interesting study: can you figure out why they failed?

Seth Godin talks about rules for public things. To sum up, with my comments in parentheses:

  1. The more often a device is used by first-time users, the more standardized the interface should be. (Most academics at a conference are early career researchers.)
  2. Who gets left out is the most important question. (No poster is meant for everyone. Also, think about people with less than perfect vision.)
  3. The best interface is no interface.

The Scholarly Kitchen has an interview with Michael Bierut about type. It includes this bit about science:

Q: The Higgs Boson — perhaps the most important scientific discovery of the past 50 years — was announced via a PowerPoint deck that used the Comic Sans typeface extensively. Why do you think the scientists chose this? Was it a wise choice?
A: Well, as I understand it, the scientists at CERN were actually surprised that people commented on this. Reportedly Fabiola Gianotti, the coordinator of the CERN program to find the Higgs Boson, was asked why she had selected Comic Sans. She simply said, “Because I like it.”

Dennis Eckmeier provides a nice examination of the shortcomings of the standard bar graph.

Elizabeth J. Petro tweeted how to put a poster away (snipped):

Just observed an incredibly clever poster rolling method: leave one side attached to board while rolling; then detach.

Oh, and while I have talked about the usefulness of QR codes here on the blog, even I have to admit this post kind of has a point:

20 September 2012

An augmented reality poster

I’ve talked about various ways to make posters more interactive, from using QR codes to showing video. This is another step in making posters more dynamic: using augmented reality.

Jump to the 4 minute mark to see what Adem Bilican did with his poster:


ECCB12 poster awards ceremony by abilican

Given this and the winning poster at this year’s Neuroethology congress, it seems that one of the ways to make a successful poster is to transcend the poster format. How can you give someone more than a piece of paper on a board?

External links

Poster prize at ECCB12 with my augmented reality poster
ECCB12 poster awards ceremony
ECCB 2012: Bioinformatics with a Swiss Flavour
ECCB12 poster prize for A Bilican

Hat tip to Guillaume Collet.

16 August 2012

iPoster

Sometimes, no graph can substitute for a good video. This is particularly true in the field of animal behaviour and neuroethology. As I mentioned previously, I was just at the Tenth International Congress of Neuroethology, and I saw a few people trying to bring video to their poster, including me.

On my poster, I did two things. First, I snitched a lot of tacks and used them to mount an iPad.


Several people thought this was brave of me. I knew it would work, because I had seen Bradley Voytek do this at last year’s Neuroscience meeting. With enough tacks, and new poster boards, that iPad was in there solidly. It wasn’t going to hit the floor unless the entire poster board went over.

Because I wasn’t by my poster at all times, and I didn’t want to leave my new iPad unattended, I printed a QR code to the video behind the iPad:


I was kind of proud of this, because I planned ahead. I used some good practices in the text (telling people exactly what the code was). I left just enough space so that this would be concealed when the iPad was in place.

Other presenters were also using iPads, but mounting them in different ways. The next two photos are from the same poster, on different days:


On day on, the presented used the iPad cover to act as a sort of lanyard arrangement.


By day two, the presented decided just to hang the iPad over the top of the poster board frame. Now this was what made me nervous.

I discovered one minor little problem with using an iPad to show people video, though. I would have liked for the video to be showing continuously, looping, so I didn’t have to be fiddling with it anew for every poster customer. There is no way to do that using the normal video app in the iPad. You have to resort to a few hacks to get looping video.

Another person, not wanting to risk an expensive iPad, just used a digital photo frame instead.


But as long as you can have someone by the poster, the risk to putting you iPad on the poster is minimal.

Related posts

How to show a dung beetle running
More power! The poster with a plug

13 August 2012

How to show a dung beetle running

I was at the Tenth International Congress for Neuroethology last week, and I think it marked the first time there was a poster competition at this meeting. Jochen Smolka won the poster prize for, “The galloping dung beetle: a new gait in insects and its consequences for navigation.”

I was not one of the judges, but this poster caught my attention because of the innovative ways it tried showed the behaviour of the beetles.

Jochen made a flipbook:


This was genius. I had a blast out of looking at this. It reminded me of Big Little books, which sometimes had little animations in their corners. I tried to take video of this, but it turns out to be hard to operate a flipbook in one hand while holding a camera phone in the other hand.

I asked Jochen how he did this. I was fully expecting that there would be some sort of business that took your video file and converted it into a flipbook.

Wrong.

Jochen frame grabbed all those images from video he had shot, stuck them into an editor, printed them out eight to a page, and made it by hand. Impressive!

Besides the flipbook, Jochen had another technique that I’ve featured on the blog several times: a QR code with a link to the video online.

But the flipbook was more effective: it invites someone to stop and pick it up in a way that a video on the screen does not. A flipbook can’t have connection problems from dodgy wifi, or is less likely to make someone give up in frustration. Even writing this, I ran into problems when tried to get the link to the video to work by typing it into my browser: in the URL listed, is the character between the D and the S a number one, capital letter I or lowercase letter L (lowercase L, as it happened)?

This is not Jochen’s first award, either; he also got an award at the Society for Experimental Biology. Nicely done Jochen.

Below is a picture of the winners of the poster competition; Jochen is far right. Congratulations to all the recipients!


Trivia! Flipbooks are called daumenkino in German, which roughly translates as “thumb cinema.”

19 April 2012

Critique: Italian cemeteries

This week, I’m featuring a poster by Kristina Killgrove, one the Killer Ks from Round 1 of of SciFund. She recently featured this poster at her Powered by Osteons blog here. Click for bigness!


The first thing that pops out are those circles. They draw the eye immediately and powerfully. Dividing the big outer circle it into quadrants ties each section of the circle to its accompanying text box.

The symmetrical layout might benefit from providing slightly stronger clues as whether to read down or across, perhaps in the headings.This is one case where numbered headings might have been welcome.


The attractiveness of the circles helps overcome that the text is a little on the dense side. Four moderate length paragraphs is not horrible, but any editing that could make the text more concise would make the poster more appealing.

Working with circle is tricky though, given that so many graphs are rectangular. The data in the upper right quadrant is coming perilously close to puncturing its border, both in the graph and table. The table is the worse offender of the two, particularly as it is covering part of the dividing line at the bottom. The table would be better off if it were smaller.

I have mixed feelings about the display text in the title. On the one hand, I like the distinctive flavour. On the other hand, it is a bit difficult to read at a glance, which is critical for a poster title. For example, look at how similar the shapes of the “L” and “I” are. Plus, it’s set in all capital letters.

The very bottom “fine print” boxes might have followed the colour scheme above, bringing more continuity to the whole poster. The cost of doing that, however, might have been less clarity in differentiating which parts are data, and which parts are not.

My favourite part of this poster, though, is a detail that might be overlooked. But there’s a delightful little Easter egg for those paying attention...


Related posts

The eye loves the circle
The uphill battle for QR codes

01 March 2012

Link roundup, February 2012

Nature has a good sized feature article on conference posters called “Billboard science”. Even better, it’s available for free at the Nature Jobs website. Warning! Contains me. Also features a poster regular readers will recognize from here last year.

The Nature article also features the work of Colin Purrington, who had just weeks earlier puts in his candidate for the worst conference poster ever.


I think I’ve seen worse, though I don’t have any photographic evidence. This at least tries to be a poster. I have seen manuscript pages tacked up on poster board. To me, that’s worse.

On the other end of the spectrum, this might be a candidate for the best conference poster ever. Or at least the people’s choice favourite.


That one should have made it into the Nature article.

Ooh, there’s a Tumblr for silly, impractical, and inane QR codes.

Finally, Cracked takes a look at typefaces. I particularly like this quote:
Mixing (serif and sans serif fonts) in a document is akin to dressing as RoboCop at a Renaissance fair. It looks dumb and makes no fucking sense.

22 November 2011

QR code subtleties

The good men and women at Poster Session are on the ball. Here, they detail a whole bunch of issues with printing QR codes on posters that are... subtle.

It turns our that QR codes need to be of a certain size, depending on the length of the URL they are pointing to. Who knew?

An even more detailed analysis can be found here. As usual for posters, the solution is to make it big! (Also, testing the code at final printed size is probably a smart idea.)

04 August 2011

Link roundup, August 2011

Over the last few weeks, I’ve seen various article that weren’t quite enough to trigger off my own post, so a linkfest is in order!

Layout


Jim Campbell discusses a comic page layout that doesn’t work.

Less relevant to posters, but also worth checking out, is the problems emerging from forgetting that people read left to right.

Typography


There are certain epic battles that just never end. Kirk versus Picard. Coke vs. Pepsi. Serif versus sans serif typefaces. This lengthy post, however, has more research ammunition to back it up than you usually find in this debate. I like this assessment of the problem near the end:

What initially seemed a neat dichotomous question of serif versus sans serif has resulted in a body of research consisting of weak claims and counter-claims, and study after study with findings of “no difference”.

Graphs


For those looking for new ways to present numeric data, check out the
slopeograph.

Conferences


The new president of the Animal Behavior Society describes how to judge a poster competition. I am interested that she thinks the content should be the only thing posters should be judged for:

What should the criteria of excellence be? I think there is only one: the best, most creative, innovative science.

QR codes


At Museum 2.0, Nina Simon talks about how she used QR codes in museum displays. Many of the issues she describes are exactly those faced by people who want to enhance their posters. Her tip? Don’t just put the code: tell people what they’ll get!

28 July 2011

The uphill battle for QR codes

QR codes offer the potential to enhance a poster in all sorts of cool ways. But there are issues to think about before you use them.

Audience side

  1. Why do I care what’s on the other side? What is the carrot for someone to take the picture with their smartphone and download? Most of the carrots I’ve seen offered by QR codes are on par with those “3 secrets of a flat stomach” ads that litter websites. 
  2. QR codes are not self-explanatory. You have to explicitly explain to someone what it is and how to do it the first time. When people first got email long ago, they included explicit instructions about how to format the addresses. It took a few years for understanding of email to become common knowledge. QR codes are at that very early stage of people’s understanding of what they are.
  3. You need a smartphone. Heck, I don’t have one.
  4. You have to have a specific app on your smartphone.

Presenter side

  1. QR codes require planning. You have to have something to link to. Given that many people do things at the last minute, making a QR code falls off the list.
  2. Most QR codes are links to the Internet, so what is that the advantage over a text URL? It can be quicker, I suppose, if the URL is long – but even that can be fixed using bit.ly or some other URL shortening service.

Still, even if you are clever enough to come up with something cool to do with a QR code, there are these little barriers that you have to get through on the audience side to make it work.

For those who argue that the biggest problem with QR codes is that they are ugly, I urge you to check out this gallery of QR codes, which take advantage of just how tolerant QR codes are to distortion. You can make some quite beautiful things with QR codes. (One shown at right.)

Don’t put anything critical for understanding of your poster on a QR code just yet.

Indeed, after I wrote the bulk of this article, a commenter in a previous post brought up that some companies, notably Google, are moving towards near-field communication (NFC) instead of QR codes for some purposes. As NFC relies on a chip, though, it is difficult to see them replacing QR codes in every situation.

Related posts

Smart posters
Too futuristic? Or already too passe?