28 July 2022

Link round-up for July 2022

One of the things I tried to do in the Better Posters book was to think about how a poster session feels for someone who is not a young healthy white man. I wish I had read this article on stuttering / stammering in conference settings before the book went to the editor.

Excerpt:

Conferences that value more than just talks are pretty cool. By this I mean ones that give travel support to poster presenters, not just those who give talks. These conferences build decent poster halls, and they don’t encourage meals during poster sessions.

From this article, it’s not clear if a poster or an oral presentation is better for people who are not fluent in speaking. On the one hand, poster presentations do not limit time. On the other, you are often trying to manage several conversations in front of a poster at once, and you can’t as easily plan and practice a talk.

But thinking about this is so important. Because issues with verbal fluency isn’t just about people who stutter. It’s about people who are not familiar with the language the conference is being held in, or any number of other issues that can lead to speech issues.

Speaking of overlooked access issues... 

• • • • •

Chartability is a tool for working with web page accessibility. But there might be a few lessons to think about with posters. The background provides substantial evidence from the academic literature that accessibility tends to focus strongly on visual accessibility. Everything else barely gets a mention.

You might want to check this out if you ever want to archive your poster online. Have you ever tried to read one of your works with a screen reader? I tried once, and it was informative.

• • • • •

New paper on teaching how to make posters dropped:

Belilos E, Kamande S, Morrison M, & Malmut L. 2022. Teaching poster design to enhance research presentation quality at academic conferences: a guide for educators. Postgraduate Medical Journal: postgradmedj-2022-141889. http://dx.doi.org/10.1136/pmj-2022-141889

Paywalled, unfortunately.

• • • • •

Backgrounds on posters are tricky. I’ve seen many that try to make it far to complicated and it quickly becomes unreadable (text on top of photos, for instance). I avoided backgrounds and just went with white for a long time, but that’s kind of boring.

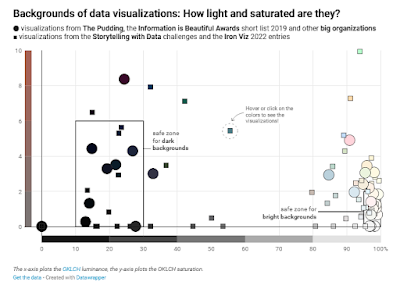
Lisa Muth has analyzed backgrounds in data visualizations, and many of the lessons apply for posters.

Graph showing backgrounds of data visualizations, clustered around very light and very dark.

TL;DR:

Your background color should be desaturated, and either very bright or very dark. If you want to be sure, use a warm, very bright, desaturated background color.

• • • • •

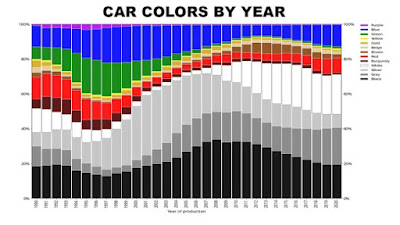
Speaking of colours, this Twitter thread points out that the world appears to be less colourful than it used to be. Monochrome cars used to be less than half of cars sold, but are now three quarters of cars sold.

Bar chart showing car colours from 1990-2020. Grays now predominate.

Big losses in green and big gains in white. Having owned a white car, I cannot quite see the appeal. Dirt shows up instantly!

Many more examples in the thread. I may be guilty of contributing to this, because I so often see colours used so badly that I tend to warn people to tone them down.

• • • • • 

Free book! Free, I say! 

Fundamentals of Data Visualization by Claude WIlke

And it’s Fundamentals of Data Visualization.

• • • • •

A Twitter thread on why so many designs are looking alike

This is a complex issue, related to industrialization, pervasiveness of internet, style trends, and just that some designs work better than others.

• • • • •

The Dead Zone
I have seen a lot of badly used colour gradients on posters. This article describes how to make your gradients look better. The secret is to avoid a grey-ish “dead zone” in the middle.

Fin Moorehouse also wrote a Twitter thread elaborating some of these ideas about how to make good gradients. Many comments that are also informative, such as how gradients look to colourblind individuals.

• • • • •

 And that’s it for this month!

21 July 2022

Cognitive load in a poster session

How hard do you have to think to “get” something? The technical term for that difficulty is cognitive load. It’s a useful concept for any sort of communication. Sinbinga and Waldron have a nice article on the concept of cognitive load as it applies to data visualization. Click to enlarge their one page summary below.

Cogintive load guide. AMount of cognitive load depends on the data, the audience, and the visualization.

I encourage reading the whole article before continuing on with my commentary.

The amount of cognitive load imposed by the data and the visualization used will vary from project to project, so I just want to zoom in and think about how the audience at a typical conference affects the cognitive load.

Connection 

“How will your audience end up looking at your work?” At some level, you’re both attending the same conference, which pushes toward intentional seeking out of work, implying low cognitive load.

But the bigger the conference, the less likely it is that your audience has come for your work, your topic, or even your field. Many people will come across your poster just browsing.

Pace

 “How long do you have the audience’s attention?” Most audience members are looking to get in and out in about five minutes. So not quite as short as someone scrolling through a social media feed, but that short timeline probably pushes the cognitive load towards “heavy.”

Knowledge 

“How much does the audience know about your data?” Like “Connection,” this can vary widely, particularly at bigger conferences. Generally, you can assume someone at the same conference has a working knowledge of the topic, but most academic posters tend to be on particular sub-fields that only a few might know about in depth.

Confidence

“How much experience does your audience have getting information from this format?” Most people attending a conference are likely to have seen something like it that mixes text and visuals. But some may not be familiar with how to interact with a poster presenter to get the most out of the conversation.

There can be differences in personality and culture that can also reduce an audience member’s confidence.

Three of these four factors – connection, knowledge, and confidence – all look like they should trend towards “light” cognitive load. But almost every conference has people who are going to an academic conference for the first time

Their connection to the discipline may be new. Their knowledge may not be extremely broad or deep yet. They may be facing imposter syndrome. All of these can push the cognitive load towards “heavy” for those people. I suggest trying to develop your poster with those attendees in mind as much as you can.

External links

Cognitive Load as a Guide: 12 Spectrums to Improve Your Data Visualizations

14 July 2022

Review: The Visual Story

Cover to "The Visual Story" by Bruce Block
The Visual Story is a book about the visual language of movies. Why am I reviewing it here? Because Bruce Block goes way down into the basics of what makes up visual communication.

When he write there are only three basic shapes (circle, square, triangle), you can tell he has cut way back on complexity to try finding the core principles behind visual storytelling.

Sure, some of the book deals with things like camera movements, but there is still lots here that applies to posters.

Block lists seven visual elements.

  1. Space
  2. Line
  3. Shape
  4. Tone
  5. Colour
  6. Movement
  7. Rhythm

For the purposes of posters, “movement” rarely comes into play, since we are typically dealing with a static document.

The remaining six elements – with one exception – may be familiar to readers of this blog. The chapter on colour, for instance, has a lot of parallels to the chapter on colour in my own book.

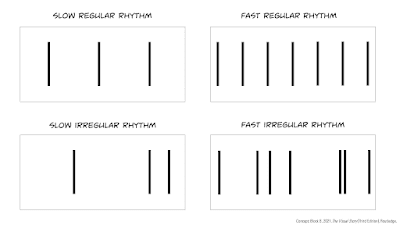
The one element that sounds weird to apply to a static image is rhythm

Think of rhythm as how often something changes as you look across an image.

Illustration of different visual rhythms. Slow regular rhythm represented by widely and evenly spaced lines. Fast irregular rhythm reprsented by narrowly and unevenly spaced lines.

Most conference posters have a high visual rhythm, and often an irregular one. Conference sessions, even more so, because you scan from poster to poster, each of which alone has a high rhythm. With the cumulative effect, it’s not surprising that poster sessions are tiring.

Block points out that all seven of these visual elements vary. Using colour as an example, red, pink, and orange are more similar to each other (which Black calls “affinity”), and blue is very different. Blue is a contrasting colour to the others.

To go back to the list of visual components, the contrasting “end points” might be:

  1. Space: Deep versus flat
  2. Line: Horizontals versus diagonals
  3. Shape: Circles versus triangles
  4. Tone: Dark versus light
  5. Colour: Hue and saturation
  6. Movement: Vertical versus horizontal
  7. Rhythm: Slow versus fast

From there, Block notes that elements that are the most different – that is, have a high contrast with each other – are the most visually intense

Contrast increases visual intensity, but affinity decreases visual intensity.

And changing that level of visual intensity can be used to support a visual story, like a movie. On a poster, I’ve written before about how contrast can be used to draw attention to things, which is a variation on Block’s idea. Visually intense things hold our attention.

In a movie that is mostly saturated bright colours, a scene that is mostly pastels is going to be visually intense. Even though we typically think of pastels as quiet and calming, if pastels are so different from the rest of the movie, it can be an intense visual experience.

Despite the depth Block brings to this subject, the book is a relatively quick read. Block uses tons of examples from movie still frames, which are quick to grasp and make his points easy to understand.

For most conference poster makers, you might not need a copy on your shelf. But it is worth checking out a copy of this book from a library. 

Reference

Block B. 2021. The Visual Story Creating the Visual Structure of Film, TV, and Digital Media (Third Edition). Routledge: New York. https://www.routledge.com/The-Visual-Story-Creating-the-Visual-Structure-of-Film-TV-and-Digital/Block/p/book/9781138014152

External links

ABT Time Episode 17: USC film professor Bruce Block and Directors Jason Ensler and Greg Tillman

07 July 2022

Same graph, different narratives

People who make data visualizations often talk about “storytelling with data visualizations.” This is something that I think can be hard for people to wrap their heads around. Let me try an example.

Here is a run of the mill scatterplot.

Scatterplot with generally increasing Y values as X values increase.

There are at least four different points you can make with that data. Probably more, but I’m just going to limit myself to the obvious ones.

First, you might be most interesting in communicating the trend.

Scatterplot with generally increasing Y values as X values increase. A regression line shows the increase. Text in the graph reads, "Overall growth."

But it’s also possible that you want to make people aware of the variation. In that case you would want to remove or minimized the trendline. If this was a timeline or other continuous record, you might join the dots.

Scatterplot with generally increasing Y values as X values increase. The individual data points are joined by a line. Text in the graph reads, "Substantial fluctuation."

Or it might be that the key point of the graph is even more focused on a small number of data points. In many cases, the most extreme data points are of interest.
Scatterplot with generally increasing Y values as X values increase. Arrow points to largest Y value and text reads, "Record high."
Low extremes can also be interesting, and annotations help contextualize what the value means.
Scatterplot with generally increasing Y values as X values increase. Arrow points to smallest Y value and text reads, "HUmble beginnings."

A graph is always intended to persuade, so why not make it easier for a viewer to see the same thing you see?

P.S.—If the graph looks familiar, it’s because it’s the first in Anscomb’s quartet.