31 December 2020

Link round-up for December 2020

Dave Rubenson explores the differences between a presentation and a journal article. Much of the advice applies to posters, except moreso.

• • • • •
 
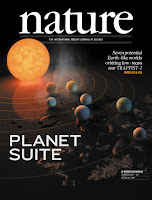
Nature cover showing arti of TRAPPIST-1 exoplanet system
Robert Hurt, an illustrator from Caltech with many Nature covers to his credit, talks about the levels of illusion in scientific illustrations in this interview from The Science Show.

One of the criticisms I've occasionally heard levied about the kind of artwork we do for exoplanets is that they look so real, people might not understand that that's not an actual photo of the planet.... 
But there is this question of if you make the artwork not as compelling, given that you can just walk into the theatre and see three different movies that are all taking you to really awesome looking worlds, do you go ahead and try to match that level of enthusiasm and do something very realistic that pulls people in, with the fear of being too realistic and maybe people walk away with a misconception that we've actually visited these places, versus maybe doing something less compelling but then it maybe won't suck people into the story.

 
There’s another interview with him here.
 
• • • • •

 Looking for a concise summary of your work for your poster title? Try TLDR

Jeffrey Perkel and Richard van Noorden wrote a news feature about this work. The technical paper is available here

It tried the abstract, introduction, and conclusion of one of my papers. The result, alas, didn’t even scan.

Lepidopa benedicti from South Padre Island, Texas, on the western coast of Gulf of Mexico acts as a population sink.

Sigh. A species cannot be a population sink. Clearly a work in progress. But promising!

• • • • •

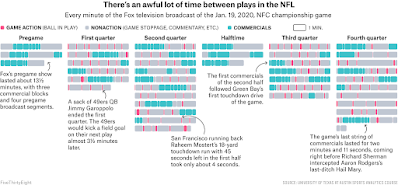
The site’s creator has been talking trash about public health. Not cool, Nate. But he is not the only one creating content on the website, so it’s worth a peak to look at the end of year round-up of Fivethirtyeight’s weirdest and best charts of 2020. I like this one showing how boring gridiron (also known as American football) truly is.

Graph showing every minute of an NFL game

The little red lines are when the ball is in play.

• • • • •

An end of year round-up of data visualizations. This is a lengthy “meta-round-up.” That is, it’s a list of lists. Will take a while to work through these. You were warned. But if you have the time, there are some fine insights in there.

Hat tip to Melissa Vaught

• • • • •

Good bye, 2020! Let’s hope that 2021 brings much more joy than just the publication of the Better Posters book!
24 December 2020

Season’s greetings for 2020

Nope. Nothing poster related today. I’m gathering steam for January, when I hope to be blogging a lot in preparation for the release of the Better Posters book.

Meanwhile...

The Human Torch writing "Peace on Earth good will to all" in flame while Spide-Man swings by

Peace on Earth.

Good will to all.

(I hope Roy Thomas, Ross Andru, and Mike Espositio don’t mind that I changed Johnny Storm’s message just a little tiny bit.)

17 December 2020

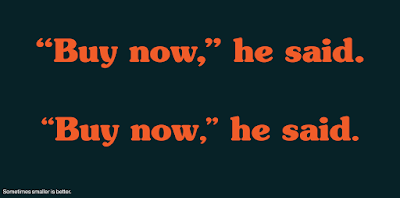
Make the punctuation in your poster titles smaller


Sample text with normal size punctuation on top and smaller punctuation on bottom

The occasional MyFonts email newsletter gave me a tip I didn’t know before. 

When you have large type, punctuation marks usually look too big. If your font is bigger than 24 points, they recommend setting punctuation points a few points smaller. 

Obviously, this applies most to titles on posters, which are (or should be!) huge.

Also remember that large type sizes often look better when the letters are spread out a little more than in book size.

External links

Fine points of designs

10 December 2020

Sports graphics, or: A moment of American football

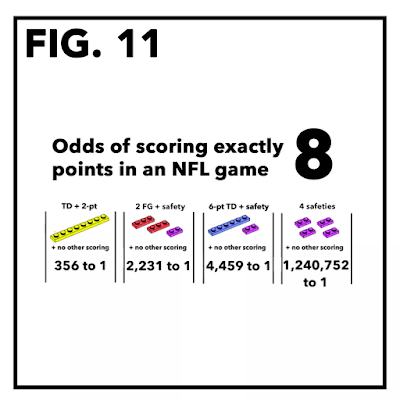
Alex Flores recommended this video on every NFL score ever. It’s good that he recommended it, because as a huge anti-fan of American football, I never would have stumbled across it myself.

If you don’t want to watch the video, you can get a sense of what it’s about in written form here

What this does a good job of pointing out is the utter numerical weirdness of American football. Whereas most games have single points, American football doesn’t. Which means scores are strangely distributed. And this makes for some interesting statistical exercises. 

Odds of scoring exactly 8 points in an NFL game

And this got me thinking about how sports graphics could be a useful source of inspiration for posters. Different games have develop different representations of play. For example, here’s a live score (or “score worm” from an Australian rules football game:

Score display from AFL game

Tennis serve placements show a fairly simple spatial representation.


Tennis serve placements from Milos Raocic in Australian Open 2019.

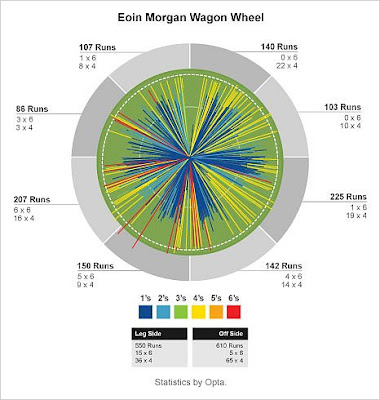
Cricket has “wagon wheels.”

Eoin Morgan wagon wheel.

It wouldn’t surprise me if sports stats graphics are often better than scientific graphics, because there is money in sports. People wouldn’t bat an eye over hiring someone just to do graphics. And the types of stats for a given sport get sort of standardized (RBIs in baseball, kicking accuracy in AFL, run rate in cricket).

Now I want to interview someone who does these sorts of thing professionally.

External links

Chart Part: Scorigami, or the story of every NFL final score that has ever happened

03 December 2020

Salmon slammin’

Felix Bernoully responded to my request for scientific graphics with a cartoon that was used in a press release. The first author of the paper drafted a single-panel cartoon using material from OpenClipArt and sent it to Felix:


This was accompanied by this caption:

Angular gyrus as part of the semantic processing area in human parietal cortex supports the comprehension of incomplete acoustic speech input in conditions in which the context allows for strong predictions regarding the incomplete word. An angling person on a Canadian river is thus much more likely to angle salmon than anything else (e.g. a shoe).

Felix had one afternoon to turn this into a more refined graphic. In two languages, no less! He wrote:

I've always been particular to the silliness of old woodcuts and wood engravings taken out of context (cf. Lucas & Morrow: What a Life! (1911)), so I decided that was the way to go.

Finding appropriate source material, preferably in the public domain, is a mix of Google-Fu (filter an image search by colour and usage rights) and rummaging through a number of sites bookmarked (e.g., The British Library at Flickr, The New York Public Library, the Library of Congress, and of course Wikimedia Commons). 
The text is set in Caslon Antique, my go-to “olde-tymey” typeface (actually a late-19th-century re-invention of well worn 15th-century movable type).

The composition was done in Photoshop, at 2,048 px width. This is a bit bigger than what is needed for the screen, but will print well at up to 20 cm (8 in) width, should the need arise.

The end result in the English version.

And this is the German version:

The German version is a little different than the English version in more than just the words.

The translation of the English cue – salmon – is “Lachs” in German, so all the other predictions the brain would be discarding because of context (angling in Canada) had to start with “La...”. Thus: Lastwagen (lorry), Lampion (paper lantern), Lasso (lasso), and Laterne (street lantern). In English "salmon" led to: saw, samovar, saxophone, and safe.

Felix notes using crosshatched illustrations has some technical considerations about resolution.

It’s always good to include a little buffer when working on pixel based images. I normally recommend about 1.5 to double the intended size as a buffer, and, of course, to use vector elements wherever possible.

The cross hatching of woodcuts and wood engravings makes them very difficult to vectorise. You’ll likely end up with insanely huge and complex files that may choke many a vector editing or PDF rendering app. So in this particular case, high-resolution grayscale (or 1-bit) bitmap images are much easier to handle.

While this particular graphic might be a little too condensed to serve as a stand alone conference poster, I could certainly see this as being a main element in a poster.

Reference

Scharinger M, Bendixen A, Herrmann B, Henry MJ, Mildner T, Obleser J. 2015. Predictions interact with missing sensory evidence in semantic processing areas. Human Brain Mapping 37(2): 704-716. https://doi.org/10.1002/hbm.23060