31 December 2009

The Better Posters checklist

Wouldn’t it be nice if there was a quick way to know if people will walk past your poster, or to know if all your friends are just too polite to tell you that your poster needs an intervention?

To help diagnose whether your poster is ready to print or ready to trash, I’ve devised a Better Posters checklist. You can click to enlarge. The enlarged checklist is readable, but I suspect what you really want is the high quality, printable PDF version.

Checklist for posters. Checklist for posters. Points awarded for Entry point, Summary,  Background,  Colours, Graphs, Image size, Image crispness, Credit, Greyness, Legibility, Grid, Flow, Hierarchy, Placement, Proximity, Proportions, Analysis, References.

This checklist was based on and inspired by the Glance Test for slides created by Nancy Duarte and Glenn Hughes. Steal from the best, I always say.

I hope that this tool will help you fulfill what should be a New Year’s resolution:

“No more ugly conference posters!”

Updated, 27 September 2017: Link to PDF repaired! Thanks to Natalia Asari for the nudge! I suppose I should also point out that this might be a useful starting point for judges who want to rate posters for a competition.

Update, 21 May 2022: I’ve updated the PDF for 2022. It no longer looks like the image above, because the original became unavailable to me when I changed institutions. I had to rebuild it from the image here on the blog. While doing so, I made some changes that I hope will make it more usable.

Checklist for posters. Points awarded for Entry point, Summary,  Background,  Colours, Graphs, Image size, Image crispness, Credit, Greyness, Legibility, Grid, Flow, Hierarchy, Placement, Proximity, Proportions, Analysis, References.

 This new 2022 version is now stored on Figshare, so should remain stable.

External links

Better Posters checlist in PDF form on Figshare

24 December 2009

Breathing design

BreezeDesign is like air.

It’s invisible.

It’s everywhere.

You only notice it when there’s something wrong with it.

Photo by Shery Han on Flickr. Used under a Creative Common license.

17 December 2009

Hold that spot: Placeholder text

Lorem ipsumMaybe want to start laying out your posters, but you haven’t written the text yet. Maybe you want to see how a new typeface will look. There are lots of little situations where you might want some words for a temporary placeholder.

There’s a solution for you. It’s called “Lorem ipsum.” It’s somewhat corrupted Latin text that has roughly the average length of words in typical English paragraphs, so it makes a good temporary stand-in for text that hasn’t been written yet. The Straight Dope provides a summary of its use, history, and meaning.

There are various “Lorem ipsum” generators that can give you the amount of text you think you need for a particular task.

10 December 2009

Leading thoughts

“Not enough room between lines” is listed as the number one mistake on this list of common typographic errors. Many of the others are aimed at books and web pages rather than large posters, so keep that in mind when scanning the rest of the list – particularly when you see, “Large body copy” listed as a mistake.

The space between lines in known in the typography business as leading (rhymes with “sledding”). What should you consider when looking at leading on a poster?

First, look at how long your lines of text are. The lines are often quite long on posters, even though this can be mitigated by the reader being some distance away. When you reach the end of the line you’re reading, you have to scan back and down to the next line. The further you have to scan back to the beginning of the next line, the more likely it is that you will lose your place. Increasing the leading helps make each line distinct in long text.

Second, look at the typeface you have. If you have a typeface with very long ascenders (the part that is taller than most lowercase letters, like the pointing up bits on l, k, and t) and descenders (the dropping down bits on letters like p, g, and y), increase the leading. You don’t want your words colliding!

Lowercase letters can pose more a subtle problem. If you have a typeface where the lower case letters are very close to the upper case letters in height (known as a large x-height), again, you’ll want to increase the space between the lines. Letters with a large x-height tend to form swaths of gray if placed too close together.

Incidentally, one more reason not to use PowerPoint to make a poster is that it tends to automatically squish the leading down to make text fit. If you’re not paying attention, your single-spaced text will change without warning to 0.9 spaced text or smaller.

03 December 2009

The eye loves the circle

Enso circleKimberly Elam wrote:

The human eye loves the circle and embraces it.

While I am a strong advocate of laying out posters on a grid, you can end up with a poster that is relentlessly rectangular. A circle can be a strong antidote to a poster filled with right angles.

Circles can be used to draw attention. It is no accident that circles are used in those ubiquitous bullet lists.

Circles can create tension. Like a ball, they suggest something that is mobile and not static.

Circles can be used to create white space. As everyone knows, a round peg will not fit into a square hole without leaving spaces.

Because they do tend to break, rather than reinforce, grids, circles are probably best used in small doses on a poster. A poster without a circle will not be noticeably missing anything. But it’s a useful exercise to consider how you might work a circle into a poster grid.

Reference

Elam K. 2004. Grid Systems. Princeton Architectural Press: New York. Amazon

Photo by user Oranguthingy on Flickr, used under a Creative Commons license.

01 December 2009

Compare and contrast: Japanese advertising posters

“With clutter ubiquitous, emptiness gets attention.”

Check Garr Reynold’s Posterous blog for a look at two very different approaches to getting attention with posters.

Conferences are visually frantic environments. Everyone is competing for attention. People’s typical response is to go for louder, bigger, brighter... and those work. But sometimes, going against the grain may be effective, too.

26 November 2009

Learning from failure

Here’s the story of an ad agency that tried to redesign a major newspaper. They didn’t get the job, but there is a lot to learn by studying what they tried to do. Here are the principles they followed (slightly edited; see original for full explanation).

Basic rule: Ignore all rules of newspaper design to start with and keep only the ones that are useful to the reader:

  1. Optimize text for reading: Big leading, big body text. We did several reading tests and found this combination to work best for reading. ...
  2. Two fonts(.)
  3. Scannability: Make the articles scannable by using key words in blue. If you speak German you can actually read the front page in 20 seconds by flying over the blue key words. ...
  4. Order: Every page is structured from top left to bottom right. Important articles are top left, unimportant ones are bottom right.
  5. Four columns for soft news, five columns for hard news, mixed 4/5 columns for sports. Ragged text for opinion.
  6. Big pictures, big info graphics, use the strength of the paper medium.

These are great things to keep in mind when designing and laying out a poster. Some are things I’ve talked about here before, like the importance of not violating reading conventions. At least one idea, how they tried to make text that can be easily scanned, is new to me and something I’ve never seen before, but definitely seems worth trying.

I don’t quite understand #5, namely the varying column sizes and changes in justification. They don’t explain the reasons for distinguishing between the different content.

Originally spotted by mocost.

19 November 2009

Scripting a poster

Page from the script for The Dark KnightWhen you’re putting together a poster, the first consideration is often just making things fit within the space. But unless you’re one of those people who puts up a poster and walks away (and if you do, shame on you), you should be thinking about what you’re going to say when you lay out your poster. In other words, you should sketch out a script for yourself.

For one poster I did, I had a figure that ended up in about column four, quite far to the right of the poster. I thought it made sense to put it there given the poster space. It felt fine when you read through the poster.

But when I gave people “tours” through the poster at the meeting, I kept referring to that picture very early on, when people were mostly examining stuff on the left side of the poster. People had to look way over to a different section of the poster, and it disrupted the flow of the presentation. (In that case, it was exacerbated by the poster being over two meters wide. People had to look a long way over to see the picture.)

Although posters are a much more casual, chatty presentation medium than a standard slide presentation that you see at conferences, don’t ignore the story you plan to tell with your poster until it’s up on the board. Talk it out to others before you finish the layout.

(Slightly) Related posts

Unwebbable: How movie scripts are typeset and why.

Pictured: A page from The Dark Knight script.

17 November 2009

Type crimes: Accidental guarantees

This is what you get for putting on text that violates the normal rules of reading. We read top to bottom, not from the outside in.

Spotted at FailBlog.

12 November 2009

Following the rules

The White Stripes have rules.

Clothes must be red, black, or white.

No bass guitar.

No equipment made after the 1960s.

And so on.

In an interview in The Guardian, Jack White said:

OMM: You must have considered how life might be outside of the White Stripes framework. Does any part of you yearn to work beyond those limitations? Or extending them?
JW: No, they stay in place. We either follow the limitations, or once in a while we break the limitations, but the point is that there’s limitations, but if there's not any limitations there, there's no point to anything. ... (T)he boundaries are there for us to play with. Since we’re trapped like that, we can keep going, and find new meaning and new depth to something really simple. There’s a male and a female, and there's three components of the music, over and over again. It never dies.

No, you haven’t stumbled into a music blog by accident; this is still the posters blog. I’ve made many suggestions about poster design that limit your choices.

Laying out your poster on a grid establishes limitations for your poster. Choosing a font establishes limitations for your poster. Being conservative in your design choices establishes limitations.

Working within limits requires discipline. Setting yourself limitations does not necessarily limit creativity; it can do just the opposite.

And if you don’t like The White Stripes as an example of creativity working within self-imposed limits, ask if Shakespeare’s sonnets are poor examples of poetry because they follow a rigid rhyming scheme. Or, if both are too high falootin’ for you, see how much mileage Dinosaur Comics has gotten out of six pictures that never, ever change.

05 November 2009

Holding the center

Bulletin board noticesNext time you walk past a bulletin board or message board, have a look at all the various notices that people have posted on it. They will probably be on different colours of paper. They will almost certainly have a dizzying array of typefaces – sometimes on the same piece of paper. But there is one feature that almost all of them are likely to share.

The text will be centered.

Similarly, if you look through a poster session at a scientific conference, I’ll bet over 98% of their titles are centered at the top of their posters. Why? There is no advantage in reading. Most word processors and other publishing programs start with text left aligned by default, which implies that people deliberately center the text all the time.

David Jury noted, “Centered arrangements were, and still are, considered to be the appropriate way of presenting a text of distinction.” I can’t find if he says it explicitly, but elsewhere in his book, he discusses that “economical and fast” is often interpreted as “cheap and low status.”

People’s tendency to center text seems to be holdover from the days when books were hard to make, and typesetting was a craft. Consider how books were typeset before computers. They had to be physically set by moving around small blocks of metal. Now think about how difficult it would be to center words, with varying letter widths and sizes, on a page by moving around metal blocks one by one: hard, time consuming and costly.

Systema NaturaeThus, centering became classy. Dignified.

The flipside of that is that, as Ellen Lupton noted, centered text can look “like a tombstone.”

My point, and I do have one, is not to say, “Don’t center the title of your poster.” I’ve centered the titles of most of my posters (though I will say, I’ve liked the results when I’ve left aligned my title). The point is to raise your awareness of a little decision that you make to follow an arbitrary convention, probably without ever noticing it.

Reference

Jury D. 2006. What is Typography? Mies: RotoVision SA. Amazon

Lupton E. 2004. Thinking With Type. New York: Princeton Architectural Press. Amazon

04 November 2009

Does embellishment improve graphs?

A new article on the Science Daily website (seemingly based on this press release) provocatively claims:

Those oft-maligned, and highly embellished, graphs and charts in newspapers and other media outlets may actually help people understand data more effectively than traditional graphs, according to new research from North Carolina State University.

Unfortunately, some people will take this article to mean that those who have argued against such embellishments, notably Edward Tufte, are wrong, and that it’s okay to make cutesy infographics that so many people think is the only way to make people pay attention to numbers. That’s premature.

The research discussed in the article was presented at a conference. Anyone who has been to academic conferences knows that a lot of research discussed there is often incomplete. Sometimes, the work never finds a home in a journal. But I thought it would be worth looking to see if there was an abstract. (Later found it at the bottom of the press release.)

A little searching turned up the online program (PDF). More complete proceedings of the meeting are available, but I don’t think I’m curious enough about this one bit of research to shell out the cash to buy it.

Searching it for the author, Doug Gillan turned up five papers he gave at this conference. It seems the one being discussed here was titled, “Minimalism and the Syntax of Graphs: II. Effects of Graph Backgrounds on Visual Search.”

In research, the devil is in the details. The abstract is so spare that it’s almost impossible to say anything about this research except that it sounds interesting. For instance, it’s not clear how reading was measured. It’s not clear how many different backgrounds were tested. It sounds like eighteen people looked at three graphs. If it was only three graphs, I would really want to see those actual graphs and how they differed. It sounds a bit like the researchers have shown an effect of contrasting shapes that is analagous to colour contrast. It may well be that a rectangle stands out against circles just that as the red petals of a rose “pop” against green leaves.

It looks like the opening (quoted above) overreaches what the study actually does. The research only looks at backgrounds, but “chart junk” comes in many other forms: pointless 3-D effects, crazy colour schemes, excessive gridlines, cutesy cartoons, and more. The summary of this research in no way provides a scientific basis to argue, “I like the 3-D effect, and science supports it’s easier to read!”

This research might provide some interesting suggestions for improving graphs. I look forward to seeing the final published paper.

Additional, August 2012: Another conference paper makes similar claims. I am not sure if this is a peer-reviewed paper, though.

29 October 2009

Critique: Ape scapula

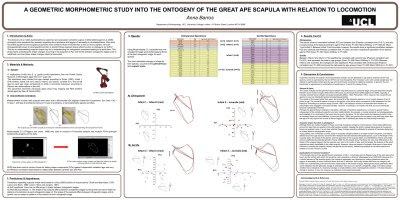
I stumbled upon this poster while reading the blog Anna’s Bones. She described as being finished “just in the nick of time.”

Ape scapula poster
A few more hours, and a stronger editorial hand, probably would have been welcomed.

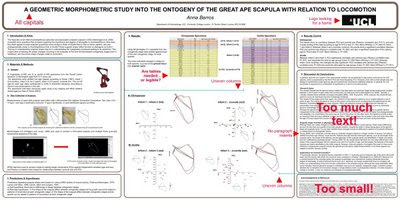
As for the title, I’ve talked before about the use of using all capital letters and why sentence case is often preferable.

I haven’t written about the use of institutional logos very much. I understand that researchers are proud of their institutions, but ask this. How many logos of institutions other than your own do you recognize? Does it really help people to recognize who you are and what you’re about?

This is an example of a problem with institution logos. Where do you put them? Here, the logo breaks the symmetry of the title bar and makes it lopsided.

Ape scapula poster critique
The three column layout is reasonably clean, although it would be preferable if all three columns were the same width. The widest center column has quite a bit of white space compared to the ones on either side, so it probably would have been possible to even them out.

Perhaps the biggest deal breaker for this poster – the one thing more than any other that is likely to make someone walk past – is the forbidding amount of text the outer two columns. The amount (lots) and size (small) is not assisted by the complete absence of any paragraph indents, which makes the text look even more like a intimidating, uniform block of gray, rather than words conveying information.

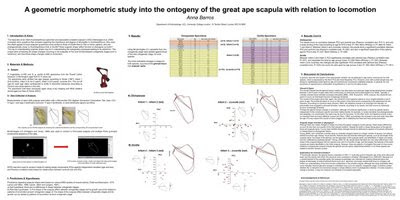
I have mixed feelings about the boxes around each section of text. In general, I think a strong layout does not need them, but I don’t mind them too much here, given the rest of the layout. In this case, taking them away doesn’t appear to help much.

Ape scapula poster without boxes
If anything, removing the boxes exposes some of the weaknesses in the layout. For example, it becomes more noticeable without the boxes that the text in the lower right doesn't align with the text above it.

In the modification above, I also changed the title to sentence case and removed the logo to see how it would look.

22 October 2009

Review: Scientific Poster Design

Scientific Poster Design is a PDF from LiLynn Graves at the Cornell Center for Materials Research. At first glance, its 69 pages make it look quite substantive. Unfortunately, the PDF is exported from a PowerPoint deck, with lots of one sentence pages complemented with low resolution clip art.

Fortunately, the advice is better than the package it’s presented in. There are good reminders of basic advice. Keep the text simple and large, use lots of pictures, and more.

One of the most useful features of this PDF is that there are lots of examples shown, ranging from good to shocking. They’re very low resolution, so you can’t read the text, but you can see the overall layout. The comments are one sentence summary judgments (“I’m feeling sleepy,” “Nice flow, but too metallic”), but are pretty much on the money. In fact, a poster critiqued previously on this blog shows up here, with some interesting “remixes” of the background.

On the other hand, there is advice that I disagree with. I would say that a poster is much more than an “illustrated abstract.” I’m also puzzled by her recommendation to use *.png format for graphs. The *.png format creates bitmapped graphics, and will become pixellated if enlarged too much.

One aspect I didn’t like are attempts at humour. We get pages showing scientists going to posters sessions for booze, lazy and profane grad students, and a competitor drawn as a caveman. (Have we learned nothing from caveman commercials?) It might work in the context of a verbal presentation, but on its own, it comes across as mean-spirited.

15 October 2009

Do you need to go to that conference?


ResearchBlogging.orgToday is Blog Action Day, when bloggers are encouraged to write about a single topic to spark debate. This year, the topic is climate change.

Research posters are created for research conferences, particularly the big, international conferences where there are more people than you could possibly have opportunities to give talks. I love those conferences. Attending conferences and presenting at them is one of my favourite things about being a researcher.

Unfortunately, big conferences can have a substantial carbon footprint. Lester (2007) wrote:

Every December, geoscientists descend on San Francisco for the Fall Meeting of the American Geophysical Union (AGU). In 2002, the 9500 participants traveled an average of 7971 kilometers to get there and back. That means their share of the carbon dioxide emitted by the planes they flew on totals about 11,000 metric tons – roughly the same as 2250 Honda Civics during a year’s worth of normal driving.
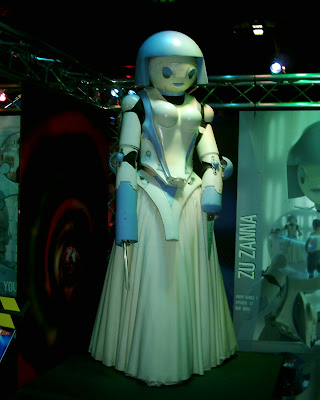
Before you start working on that poster, think hard about the conference, the distance to it, and what you expect to get out of it. Ask, “Do I need to go to that conference?”

Reference

Lester B. 2007. Sustainable science: Greening the meeting Science 318: 36-38. doi: 10.1126/science.318.5847.36

No more slidesters, interlude: Making presentations more like posters

Form follows function. The function of PowerPoint is to emulate a series of 35 mm slides. Because many researchers use PowerPoint for their talks and lectures, they also tend to use it for every graphic problem, including posters. Predictably, the form of the resulting posters often look like nothing more than a series of ugly PowerPoint slides tacked together.

A poster is more like a whiteboard than slides. But because many researchers give more presentations than posters, they’re not used to thinking in terms of a big space, viewed all at once, instead of a series of small spaces, viewed one at a time.

If you want to break out of the “Next slide, please” rut, check out Prezi, presentation software that is available free online. Its presentation metaphor is that of a big whiteboard, much like a poster, rather than individual slides. There are many things you can do in Prezi that you cannot do with a poster, like zooming in and out. Prezi is still very much a work in progress. Currently, you don’t have a lot of control over graphic elements; you have only limited ability to change fonts and colours and so on.

Nevertheless, it forces you to think about using space in a totally different way than you do when using PowerPoint. It’s good practice.

The “No more slidesters” series will be back after I have time to sit and review more software!

13 October 2009

Explaining a handle

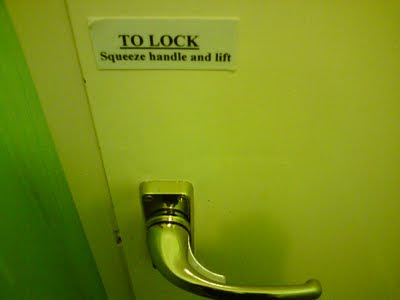
Calling someone a “doorknob” is an insult to intelligence because doorknobs are simple. At least, they should be. From Tim Tucker Online, where Tim writes:

If your door handle needs a note explaining how to use it, you know there’s got to be something wrong with the design.

Door Handle
Not sure who said it first, but it bears repeating: Design only calls attention to itself at the point of failure.


Spotted on Twitter.

Related posts

Don’t hold my hand

08 October 2009

No more slidesters, part 3: Draw in the open

As discussed recently, many people use PowerPoint to design posters, an act that borders on criminal. PowerPoint was designed for multiple projected images with minimal text, not one large image with complex text and graphics. People use PowerPoint because it’s the only thing remotely resembling a graphics software that people are familiar with. Microsoft Office simply doesn’t have a good, high end graphics component. Publisher comes close.

OpenOffice does have a graphics component, simply called Draw. If you are not willing to shell out the big bucks generally required of a professional graphics software package, Draw has several features in its favour.

First, it makes vector based images. This means that the images created in it will stay sharp even when printed very large.

Second, it has a PDF export function. This makes it easier to print at just about any workstation with a printer.

Third, it is free.

It is not as feature rich as commercial software, and I’ve found it to be a trifle buggy. It is not perfect, but whereas PowerPoint might get you 40% of the way to what you need to make a good poster, Draw probably gets you closer to 80% of the way there.

If you’re looking to put pixel-based images on your poster, but don’t have a full professional graphics package (though every scientist should have one), check out GIMP.

01 October 2009

No more slidesters, part 2: Three Publisher tips

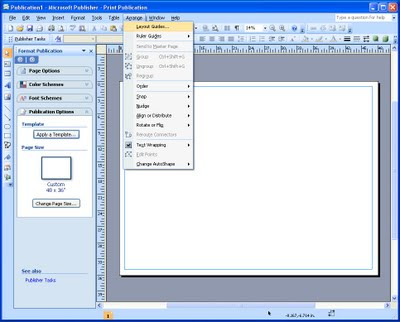
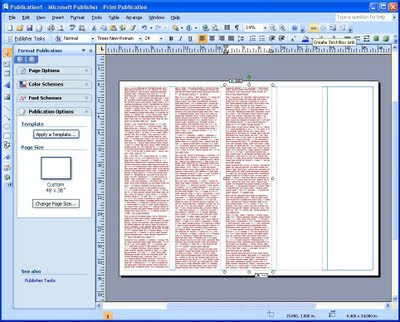
I have used Microsoft Publisher a lot for posters, as I mentioned previously. I’m going to show three easy things that Publisher does well that are useful when making a conference poster.

Grids are a cinch


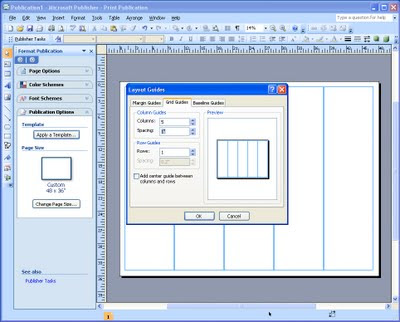
Grids are at the heart of successful poster design. Under “Arrange,” pick “Layout guides,” then pick the “Grid guides” tab.


From there, all you have to do is pick the number of columns you want to have, and the space between them. And you’ve now got an evenly spaced grid!


Setting up grid guidelines in other programs is rarely this painless. You usually have to do a lot of calculating to set up each individual guideline.

You can also set up rows in the same way. This is not as useful as often in posters, which are usually dominated by vertical divisions, rather than horizontal (apart from the title).

Once you’ve got columns, draw a single text box in each one and paste in your text. Because posters usually have many graphics, you’ll want to insert pictures, too. This is where another feature of Publisher comes in handy.

Text wraps around pictures


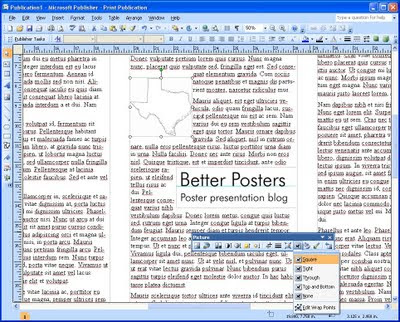
Many other programs either cannot wrap text automatically (like PowerPoint) or make you jump through hoops to get there. When you insert a picture into Publisher, the text will normally flow around it. If the picture is the same width as the column, the text will break and continue below it.


The default spacing is not particularly graceful, so it is worth fiddling with the settings after the picture is in so that the text isn’t too close to the picture.

Joining text across columns


Many people, particularly those working with PowerPoint, create their posters as a zillions small text boxes that almost invariably go out of alignment because there are so many of them, and they are all different widths. Publisher allows you to link text boxes into one continuous piece of text.

Click on a text box. If there is more text than will fit in the space, it will show an “overflow” symbol at the bottom. On the menu bar, there is a “Create Text Box Link” button. Click it, then bring the mouse down to the next column. The mouse icon will change to a bucket. Click it within the box to “pour” the overflowing text into the next column.


Continue this for each column. Once this is done, the text will automatically rescale through all the text boxes. For example, if you add a picture to text box one that displaces some of the text, the text will shift down automatically, through to the last linked text box. The same thing will also happen if you enlarge or reduce the text.

24 September 2009

No more slidesters, part 1: The wrong tool for the job

Many people have discussed the deficiencies of “sliduments”: PowerPoint printouts that are given instead of actual, detailed prose documents. See also here.

PowerPoint logoAnother misuse of PowerPoint is to use it to create large posters. My experience has been that PowerPoint is abysmally suited for this task. That said, I have not used the 2007 version of PowerPoint that was released along with Windows Vista, but I have suspicions that at least some of the problems I had are still true. The main reason I suspect this is that I deal with posters for HESTEC from our department every year for the last four. And every year I am horrified by the PowerPoint posters. People only do this because they know PowerPoint and think it’s “good enough” for the task. My reaction is much like that of William T. Riker: “‘Good enough’ never is.”

In the last version, PowerPoint was limited in how big a poster it can make (56 inches, according to here). Some conferences give several feet of space, and PowerPoint couldn't reach the large sizes.

PowerPoint is also wretched at typesetting and handling complex layouts. It’s harder to change even basic paragraph settings like line spacing in PowerPoint than Word. Perhaps the fatal flaw is that the heart of any poster layout should be a consistent grid, and setting up a grid in PowerPoint is very difficult. Consequently, I see many posters where I’m willing to bet that no two items on them are actually aligned. They’ve been roughly kinda sorta eyeballed.

Yet using PowerPoint is so entrenched for making posters that printers provide PowerPoint templates for clients and actually encourage the abominable practice.

Strangely, many who use PowerPoint have an much superior tool at their disposal: Publisher. It’s part of the standard Microsoft Office package, but not many people are aware of it. It uses many of the same commands and logic as the other Office software that people know, so its lack of popularity is all the more surprising. Publisher has its limitations, but the improvement over what one can do in PowerPoint is huge.

(Original version posted at NeuroDojo.)

17 September 2009

Containment

Posters have to be self-contained, in two senses of the word. This is a major difference between posters and slides.

EcosphereFirst, you only have a single canvas for a poster. Everything has to fit within that space. In contrast, it’s rare to have only one slide. Slides are gregarious things, preferring to appear in swarms. With digital slides now the norm, you effectively have infinite space (even though you see only one small section at a time).

Second, posters should be understandable when the presenter isn’t there to explain it. Slides are almost always intended to accompany a speaker, and explicitly serve as aids to a presentation. You never walk into a room at a conference where there’s just a series of projectors, with slides flicking by on auto advance.

Thus, a poster will always have more elements to consider than any one slide. This presents a bigger challenge to layout, and causes greater planning demands.

One of the biggest struggles in designing a poster is to decide how much can be removed without making it impossible for someone to understand the poster when the presenter isn’t around. Unfortunately, there are no easy rules of thumb to follow.

10 September 2009

Periodic table of typefaces

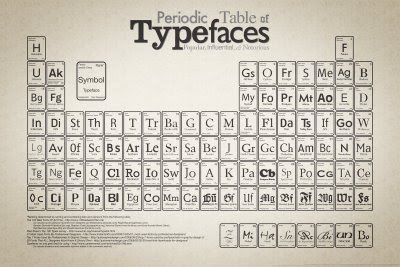
Periodic Table of Typefaces
This graphic puts a large number of fonts “at a glance.” Mimicking the periodic table of the elements is an interesting idea, although it’s more a gimmick than anything useful, unlike the periodic table of the elements, which reflects nature.

Found in the article, 40 Useful and Creative Infographics at Six Revisions. Many of the other graphs are worth looking at, particularly for the use of colour and the integration of text and graphics. Many may be too dense for posters, however.

03 September 2009

No need to shout

As a scientist, I have to keep up with journals in my research field. For most journals, I get an RSS feed with the title and abstracts of journal articles. There is one journal, however, for which I respect the science, but hate their feed. Because they set all of their article titles in all capital letters:

ShoutHOW TO PREVENT CHEATING: A DIGESTIVE SPECIALIZATION TIES MUTUALISTIC PLANT-ANTS TO THEIR ANT-PLANT PARTNERS
EXTREME HOST PLANT CONSERVATISM DURING AT LEAST 20 MILLION YEARS OF HOST PLANT PURSUIT BY OAK GALLWASPS
GENETIC ARCHITECTURE FOR THE ADAPTIVE ORIGIN OF ANNUAL WILD RICE, ORYZA NIVARA
GENETIC DISTANCE BETWEEN SPECIES PREDICTS NOVEL TRAIT EXPRESSION IN THEIR HYBRIDS

Admit it, you didn’t read any of those. You skipped here to pick up the conversational thread, didn’t you? (In fairness, it’s not quite as bad in the RSS reader as they appear here, because there is a little space between entries in the reader.)

When I look at those article titles, I can feel my brain “gearing down” every time. Reading slows to a crawl. The experience drives me nuts. When I’m looking at the feed, most entries are irrelevant to me, so I skim, doing a quick search for topics that interest me.

And that is exactly the same situation I’m in during a poster presentation session. Yet many people insist on setting their poster titles in ALL CAPITAL LETTERS.

Compare the experience of reading this to the above. The titles are the same, and much could be done to improve the distinction between each title. Even so, just setting them in regular sentence case makes them they less likely to cause someone to skip over them immediately.

How to prevent cheating: A digestive specialization ties mutualistic plant-ants to their ant-plant partners
Extreme host plant conservatism during at least 20 million years of host plant pursuit by oak gallwasps
Genetic architecture for the adaptive origin of annual wild rice, Oryza nivara
Genetic distance between species predicts novel trait expression in their hybrids

Putting long sequences of test in all capital letters looks like you’re shouting. It’s as unpleasant an experience in type as it is in person.

If you are clear, you don’t have to be loud.

Related links

Questions About All Caps Setting, 29 September 2009, FontFeed blog.

01 September 2009

Type crimes: Accidental sentences

In the last post, I talked about the power of proximity in structuring text and guiding readers through the text. Here’s an example of where that power of proximity has (unintentionally) been used for evil – or at least amusement – rather than good.


From Failblog.

A tiny little line is meant to divide the text to make it clear, but the proximity of the words overpowers it and rearranges two movies titles into one new sentence.

Here’s another example.

27 August 2009

Don’t hold my hand

ResearchBlogging.orgErren and Bourne (2007) offer 10 tips for poster design. But as is often the case, there is a point I will contend. They write:

Guide the reader with arrows, numbering, or whatever else makes sense in getting them to move from one logical step to another. Try to do this guiding in an unusual and eye-catching way.

You should not have to guide your reader. Having to do so is indicates failure of design. Audience members at a research poster session are experienced readers, and are smart enough to know and follow the conventions established for the written English language that are all around them. Signs, magazines, newspapers, movie credits, comics, blogs, and get along perfectly well without “unusual and eye-catching” directives to show the next step in the sequence.

You can use layout so that people can read through your poster without resorting to explicit directives as to where to go next.

Fantastic Four art by Jack KirbyLet’s look at this page from the king of comics, Jack Kirby. It’s a grid of two columns and three rows of squares, and the spaces between panels don’t provide a clear clue to the reading sequence.

In theory, you could either read this as two top-to-bottom columns, or three left-to-right rows. If Kirby followed Erren and Bourne’s advice, there would be arrows running between the panels, or numbers in each panel, so that readers could follow this page.

Yet even young readers know to read the panels in rows.

The placement of the word balloons is the key to reading sequence. When you’re reading the first panel in the upper left corner, the next closest balloons are to the right, not down, thus encouraging the correct reading sequence. Many of Kirby's pages are laid out this way: The word balloons running almost straight across the top of each panel, in close proximity to each other. The artwork underneath distances the balloons from each other in the vertical dimension, making a reader less likely to wrongly follow down first instead of to the right.

And the moral of the story is: Put related objects close to each other.

In a poster, well defined white space can serve the role that art does here. Clear bands of uninterrupted white space can be strong cues to the reader as to the direction of the reading flow.

Reference

Erren, T., & Bourne, P. (2007). Ten Simple Rules for a Good Poster Presentation PLoS Computational Biology, 3 (5) DOI: 10.1371/journal.pcbi.0030102

Related links

How to: Balloon placement
by maestro comics letterer, Todd Klein

24 August 2009

Poster makeovers?

Trinny and SusannahAt Mind the Gap, Jennifer Rohn mentions a title that set my mind ablaze with possibilities:

Science PR: do we need a Trinny and Susanna for scientists?

Not sure why the link in the Mind the Gap post doesn’t lead to a post with that title, but no matter.

I’d heard about this duo Trinny and Susanna before as the original What Not To Wear team in the UK, and as the inspiration for robots in Doctor Who (below), before finally seeing them in Making Over America last Friday. And I can see why they are so popular: They’re good at what they do.

I wouldn’t want to do what Trinny and Susannah do for scientists’ dress sense. But I would love to take their approach for scientific presentations. I would love to go to a big conference like Neuroscience, find posters that just makes you go, “This is not helping!” and take the presenter through the whole cathartic process of critiquing and rebuilding the poster from the ground up.

I don’t think it would make great television, but it just might work as a social event at a conference, if done with humour and with the right format.

Link love

Editor of Open Lab 2009Over at Neurotopia, SciCurious has many fine tips for poster presentations. It’s an extended repost, and you may want to hit the earlier one for the comments. Sci’s perspectives are well worth checking out.

And yes, Sci is the editor of the next Open Laboratory 2009 anthology. If you aren’t familiar with this project, check here to see the posts nominated so far. (Warning: The Better Posters blog is not responsible for any declines in productivity suffered from incessant browsing of fine science blogging.)

20 August 2009

Is there anything new to say about graphs?

For a blog about poster presentations, a medium that is most associated with scientific and technical discourse, I haven’t written much about the element that most researchers consider to be the heart of their poster, the data.

The reason for that is most data are presented as graphs, and it’s very hard to find anything substantive to say about graphs that Edward Tufte hasn’t said already. Tufte has written four rightfully famous books about graphs, and for any researcher doing technical data displays, they are must reads. These four books are:


  • The Visual Display of Quantitative Information

  • Envisioning Information

  • Visual Explanations

  • Beautiful Evidence


These books are not without flaw (I reviewed Beautiful Evidence at my other blog, NeuroDojo, here), but they provide an invaluable starting point for thinking about graphs, charts, and related visuals. And Tufte is, of course, not the only person who has written on the creation of technical graphs. While I may not be able to say more, I do have some recommendations.

First, replace tables with graphs. Almost any information than can be placed in a table can be shown in a graph. Tables require more reading and interpretation, whereas graphs are more likely to serve as an “entry point” for your audience.

Second, make graphs just for your posters. Many people recycle graphics prepared for journals or slides. Figures for journals often have to be printed in black and white, but there is no reason a poster figure should be so limited. Additionally, journal figures can be very detailed, because a reader can examine them at his or her leisure, whereas you may have only a few minutes with a fellow researcher at a poster. Figures for slides are often too low resolution to be enlarged for printing on a poster. Both could be in proportions that are completely inappropriate for the layout of your poster.

Remember, only you can prevent graphs that look like this ending up on your poster!


(Shudder.) Hat tip to Garr Reynolds for drawing attention to that last graph on Twitter.

18 August 2009

What do you do with the poster?

Nature PrecedingsYou’ve lugged your poster all the way to a conference, given your talk, had people compliment you on how beautiful it was, to which you say, “Thank you! It’s all thanks to the Better Posters blog,” lug it all the way back home...

And then what?

Not so long ago, almost all you could do was maybe to hang it up in the corridor of your building. Now, there are a few archive sites for them. I’ve dipped into ePosters.net for some poster critiques, to name one.

Nature has recently launched a site for pre-publication results called Nature Precedings. The Ecological Society of America recently sent out an email following their annual meeting encouraging participants to consider archiving their talks and posters. ESA secretary David Inouye cited these advantages:

  1. You can cite it in job applications or grant proposals.

  2. You can point prospective students to it, as well as anyone who wasn’t able to make it to your presentation or poster during the meeting.

  3. It’s free to post the presentation, and you won't have to worry about archiving it elsewhere or maintaining it on your own server.

  4. We may in the future be able to link these archived presentations to the online meeting program.

  5. Historians of science and future students of ecology will be pleased to have the additional source material when they’re writing their books about you.


That said, there are some potential disadvantages. The biggest one is that archiving something could run you into problems with editors when you try to publish. Currently, most journals abide by the Ingelfinger rule, named after Franz J. Ingelfinger, the editor of the New England Journal of Medicine, who declared in 1969 that they would not consider a paper for publication if its results were published elsewhere. Although conference abstracts are usually not considered a problem, archiving a complete presentation is new. It’s not clear how editors might react.

Of course, you can always archive your work after the paper is accepted for publication.

13 August 2009

Entry points: Five ways to make your poster more inviting

Puls BiznesuPoster presentations are often crowded, often busy spaces with many people who have never met you or know with your research.

What do you have on your poster that beckons someone to come closer?

What on your poster might reach out to someone strolling by to lean in and have a second look?

Jacek Utko is a designer, best known for his work on Eastern European newspapers, who has been mentioned on this blog before. He argues that such questions are not simply some sort of cheap salesmanship, but necessary for people to connect with content.

People need entry points to text. People look at headlines. People avoid long stories. There are many proofs for this, such as eye-tracking research.

I am somewhat cautious about over-interpreting research when it comes to design, but Utko’s remarks are helpful ways to think about poster design. What kinds of entry points can you have on a poster?

Here are five suggestions to make your poster more inviting.

  1. Pictures: Use a big, high quality photo that relates to your topic. In biology, one of the simplest entry points can be to have a big picture of the organisms you are working on. Graphs might work as an entry point, but tables almost certainly would not.

  2. Headlines: This is not just the title, but section headings, too. Have you considered something more descriptive than the stock phrases used from journals? “Introduction.” “Methods.” “Results.” “Discussion.” Section headings might become a little like...

  3. Pull quotes: These are frequently used in newspapers and magazine. They’re one or two juicy bits in a story, set off from the rest of the text in large type, that give a bit of a teaser as to the content of the interview. But apart from the occasional descriptive section heading, I have never seen them used in posters.

  4. Circles: “The human eyes loves the circle and embraces it,” writes Kimberly Elan in her gook Grid Systems. Maybe this is why bullet points have proved so popular. Considering that posters are built around rectangles shapes, having a circles somewhere in the layout might attract more attention than you think.

  5. White space: Don’t underestimate the intimidation factor of a poster that is chock-a-block with text. Leave some breathing room.

08 August 2009

Free fonts

Ripe sampleSmashing magazine provides a list of superb free or cheap fonts for you to try. As the comments note, some of these are not for commercial use. Plus, these are in a variety of formats that may not be useful to all users. In come cases, Mac users are out of luck. In some cases, you have to know what OpenType is.

Hat tip to Garr Reynolds.

Pictured: Ripe font.

06 August 2009

Type crimes: Species names

My major academic research concerns crustacean nervous systems, so I was very interested in a recent article on for the electronic journal JoVE (the title is derived from the acronym for Journal of Visualized Experiments) on the stomatograstic nervous system in crabs. You’ll have to trust me when I say that in my field, that preparation is famous for its elegance and notorious for its difficulty. The picture gives only a hint of how many fine placements are required.

As I was watching the video, I noticed how the article title was typeset.

Cancer Borealis Stomatogastric Nervous System Dissection.”

And I cringed.

Now, that may look fine to you, but as a biologist, there are rules about writing species names. They have two parts – check. They are always set in italics – double check. The first part of the species name, for the genus, is capitalized – check. The second part of the name is entirely lower case – fail!

In our department, we harass students about the correct way of writing species names. Not setting a name in italics is an amateurish mistake, and we hound students relentlessly on it. It’s probably the few typographic guidelines that they ever have to contend with.

If you’re not a biologist, how does this affect you? It probably doesn’t. The point of this example is that a decision about casing introduced an error. Perhaps a minor error, but an error nonetheless.

Capitalizing only the first word, as here, is usually called sentence casing. Capitalizing every word in a sentence is called headline casing. If you want to set something in headline case, check that you’re not violoating any other rules. Ask why you want to use headline case. Is it just for emphasis? Because there are other ways that can be achieved, such as with font size, weight, colour, and so on. None of those would violate the rules for species names.

30 July 2009

Columns: How many?

That most posters are wider than tall (landscape layout) means that the text and graphics will be arranged in a series of columns. This number and width of columns is probably the single most important factor in designing a grid for a poster.

How many columns should a poster have?

Some designers find even numbers of divisions too symmetrical and staid, like folded paper. Thus, you may want to try for an odd number of columns, like three of five. Alternately, you might work with a grid that is some multiple of three.

There’s another reason to consider trisecting your poster space. Photographers and graphic artists often talk about the “rule of thirds.” The idea is that the most visually interesting images, pages or photographs often have their focal points off center, at one of the four points formed by intersections of imaginary lines that divide the space into thirds both vertically and horizontally.

This is easier to show than describe.


The red crosses show the preferred points for locating the items of most interest. In photography, these might be the eyes of the face, say. Locating things on those points in a technical poster is a bit more complex, but that’s a post for another time.

If there is any text that is long enough to form a paragraph, the size of the type has a major impact on column width, and therefore column number.

A narrow
skinny
column of
text can
be highly
annoying,
because you
are forced
to keep
sending your
eyes back to
the start of
the line.

Reading extremely wide paragraphs of text makes it easy to lose which line you’re reading as you continue to scan across. I’ve had to make the text very small to show an example of this phenomenon, because I can’t easily adjust the column width for this blog, so I hope you can see the point. Sorry for the eyestrain.

According to Jury (2002), a good guideline for paragraph width, and therefore column width, is about ten to twelve words per line of text. You will find plenty of situations where this guideline is not followed; some magazines have narrower columns, maybe six to eight words wide. Nevertheless, those principles alone probably give you a very solid starting point for a grid.

References

Jury D. 2002. About Face: Reviving the Rules for Typography. Rotavision SA: Mies.

23 July 2009

Critique: Crustacean digging

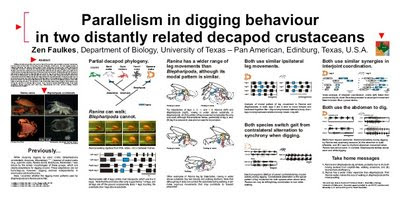
Turnabout, it is said, is fair play. Since I have critiqued other peoples’ posters, I thought I would put up one of my own. Now, obviously, I am going to pick one that I am generally pretty pleased with, but I’m not going to claim it is perfect.

Before I go on to the critique, let me give you a few pieces of information. This poster was done for the Society of Integrative and Comparative Biology (SICB) meeting, which gives one of the most generous poster sizes of any meeting anywhere. It’s something like 230 cm (7 feet, 8 inches) across. Another thing that makes SICB unusual is that they actually request that posters include the abstract on the poster. Many presenters do not do this, but I like to follow guidelines when I know about them.

Faulkes 2002 SICB poster
Even with a few years distance between me and the meeting, there is a lot I like about this poster. The columns are clear and well defined. There are big headings that allow you to take in the gist of each section with a quick read. It is highly visual, with most of the space being take up with pictures. There’s a little colour incorporated into the figures, and it is used consistently. The icons of the species are always the same colour, for example.

Faulkes 2002 SICB poster critiqued
That said, the title is much larger than it needs to be. Looking at it now, I would reduce the title size to give the columns below some more vertical white space.

The small map to the right of the title reflects my insecurity. I had just started a new job at a new university with very little research track record at the time, so I knew “Where’s that?” would be a commonly asked question. It’s a distraction that I should have removed.

I generally hate having abstracts on posters, but I can console myself by saying that SICB made me put it in.

The photo compilations, while neatly aligned, could probably benefit from having a little more white space between each frame.

Now it’s your turn. Does this poster show evidence that I practice what I preach in poster design?

References

Faulkes Z. 2001. Parallelism in digging behaviour in two distantly related decapod crustaceans. American Zoologist 41(6): 1642. Archived at ePosters.net, EP10900.

17 July 2009

Blue collar graphs

At Seth’s Blog, Seth Godin has suggestions for how to make graph that work. His first point, “Don't let popular spreadsheets be in charge of the way you look,” echoes something I wrote recently, which will be a recurring theme here:

Design is all about making decisions.

Because Seth’s specialty is marketing, his advice to make sure every graph tells a story may not always be necessary for a researcher to implement. In research settings, graphs are often used to show details that are pieces of the big picture, whereas in business, the graphs are the big picture.

Finally, Seth is also a fan of being conservative, much like Rob Sawyer is with book layout. Following established conventions helps the viewer. And if you think following conventions limits your creativity, ask if Shakespeare found the rigid rhyming scheme of sonnets too restrictive.

Additional: A follow-up at Charts.