I have seen a lot of repurposing of fabric posters, but this one is surely the cutest:
Ferran Nadal-Bufi writes:
Award winning poster on peptide-based drugs to target cancer becomes play mat for tummy time 🥰
Hat tip to Needhi Bhalla.
• • • • •
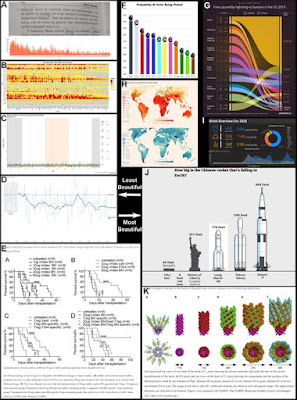
In my field of neuroscience, it’s been known for some time that images of brains “lighting up” are more persuasive that tables or graphs. So a new preprint that suggests graph aesthetics influence their persuasiveness is not especially surprising.
Lin C, Thornton MA. 2022. Fooled by beautiful data: Visualization aesthetics bias trust in science, news, and social media. https://psyarxiv.com/dnr9s/
The authors say the graphs on the left were considered least beautiful, and the ones on the right were most beautiful.
A Twitter thread 🧵 from one of the authors is here.I suspect a lot of people will flip out about this, because academics have been made very twitchy about misinformation. Any many cling to the idea that a graph should somehow be a completely neutral and impartial conveyor of data.
But graphs have always been a tool for persuasion.
So the lesson here is not only, “Be suspicious of beautiful graphs,” because really, you should be suspicious of any graph, but also, “It is worth the time and effort to make a nice graph, because it will spread your ideas farther. And as Seth Godin says, ‘Ideas that spread, win’.”
• • • • •
Last year, one of the big things that happened to me was getting my right eye fixed up. I’d had low vision for a few years, thanks to an undiagnosed cataract. I’m glad to be rid of it and now have the best vision I’ve had since I was a kid. But I am also greatful for the experience because it made me more alert to problems face by people with visual impairments that can't be fixed with a simple surgery.
On that note, I’m currently trying to lay my hands on a copy of:
Wu Y-H, Martiniello N, Swenor BK. Building a more accessible conference for researchers with vision impairment. JAMA Ophthalmology. In press. https://doi.org/10.1001/jamaophthalmol.2021.5613
If anyone has a copy, please email me! It seems relevant to my interests.
• • • • •
“How to present a poster at a conference?” is a short chapter (Chapter 3) in the book, How to Practice Academic Medicine and Publish from Developing Countries? A Practical Guide. (The authors chose to have a stylistic thing where not only the book title, but the chapters, and every heading ends in a question mark, whether it needs it or not.)
Open access and free to read.
Nundy S, Kakar A, Bhutta ZA. 2022. How to Practice Academic Medicine and Publish from Developing Countries? A Practical Guide. Singapore, Springer Singapore. https://doi.org/10.1007/978-981-16-5248-6_37
• • • • •
Helena Jambor reviews trends in data visualization for 2021. Topics include:
- The ubiquity of the “viridis” colour scheme
- Axis breaks
- Slope charts
- Pictograms
- Scale bars
And more!


No comments:
Post a Comment