29 July 2021

Link roundup for July 2021

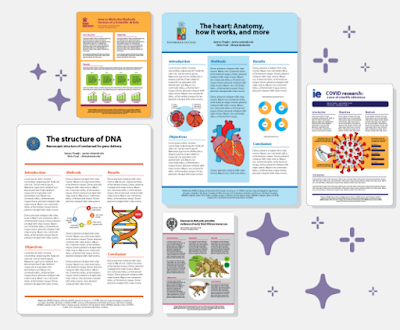
Animate Your Science has a gallery of four excellent conference posters. They even go so far as to call them the “best” posters! The post has a nice little evaluation checklist:

  1. First impression
  2. Title
  3. Colour scheme
  4. Layout
  5. Figures
  6. Other features of note
  7. What could be improved?

One of the posters, by René Campbell, was recently featured in one of the link round-ups on this blog. I’m pretty sure I’ve seen Caterina Funghi’s poster somewhere, too!

• • • • •

Mind the Graph has released a poster making app

Sample posters make with Mind the Graph poster maker.

 I hope to have a review in the near future.

• • • • •

Echo Rivera reviews the Animate Your Science poster design class and brings in a few ideas of her own on poster design. 

Echo specializes in slides, and her post talks a little about the similarities and differences of slide talks and posters.

Similarities: You need to storyboard that 💩! 

Differences: One big blank canvas instead of a bunch of little ones.

But there’s more good points in her post!

• • • • •

Baker and Philips have a short paper in the Journal of Perioperative Practice about how to make conference posters. Excerpt:

Sometimes scientists will be asked to present their research to members of the public in a poster.

Has anyone ever done this?

Hey, perioperative practice practitioners, send me your posters!

• • • • •

The last year, I’ve tried to get a handle on what people mean by “online posters,” “electronic posters,” and “digital posters.” But I think I would balk at calling an Instagram post a “poster.”

But maybe this paper about using Instagram to teach chemistry will change your mind.

• • • • •

Yet another study showing that conference talks are more likely to be published than conference posters. I don’t think I have ever seen a study (of which thee are many) where that has not been the case.

• • • • •

This graph purports to say something about crime, but the graph itself is a crime. Click to enlarge if you don’t see the problem.

CNN graph with time on X axis running from right to left instead of left to right.

Catch it yet?

Time on the X axis is running right to left, not left to right.

Hat tip to Oren Gur and Katie Mack.

• • • • •

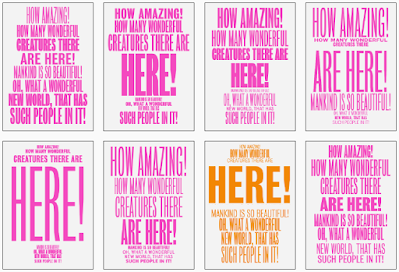
A paper about automatic typesetting for “posters” (but really, short blocks of text). 

Eight posters with the quote, "How amazing! How many wonderful creatures are here! Mankind is so beautiful! Oh, what a wonderful new world, that has such people in it!"

The images above are found in the supplementary information. Interesting as proof of concept, maybe.

• • • • •

A PDF by Shanda Hunt about presenting research.  This appears to be supporting documents for a webinar, but it stands alone.

• • • • •

Students love posters! At least according to the title of this article by Lamar and Sheperis, who asked students in counseling to make a conference-style poster presentation. The text of this short paper describes the exercises students did. The evidence of students loving the assignment is brief:

According to follow up surveys of the classes, the Virtual Research Conference Presentation assignment is loved by students because they get to be creative and explore a topic of interest to them.

Maybe this paper could have been a little longer?

• • • • •

Posters as student assignments are also described in this article by Tarigan and Listyani. This has more assessment of the outcomes, but for only three students and three teachers.

• • • • •


Li and colleagues describe how they organized an online conference in 2020. It includes this description of  how they handled poster sessions.

The poster session provided an opportunity to experiment with GatherTown, which aims to approximate the experience of in-person interaction. GatherTown enables the building of 2D environments that can be designed to simulate a conference hall, complete with space to ‘hang’ posters. Delegates navigate around the space with an avatar [the happy default being a yellow-scarfed snowman] and can zoom in on posters they wish to see. A delegate’s video and mic are on at all times but only become visible and audible to other delegates when their avatars are physically near each other. Delegates could also search and message other delegates directly. The conference feedback suggested that delegates enjoyed this format of seeing posters.

Here is their figure for how that looked. Click to enlarge!

I tried a GatherTown demo. And oh my, but does it have some strong old school role-playing game vibes. It’s cute. But I’m not sure “cute” is the vibe I’d necessarily want for an academic conference.

• • • • •

Love this one-liner from Nancy Duarte:

We rely on data to tell us what has happened, and stories to tell us what it means.

The article she is linking out to, by Hanna Marcus, is also good examination of the relationship between data and empathy. 

When writing about conference posters, I am acutely aware that I am often giving advice that is not data driven. And my people, fellow scientists and other academics, have been trained to be extremely data driven. So much so that long established conventions tend to get dismissed until someone “rediscovers” the practice by some experiment or other.

Data matters, but it is not the only thing. You need narrative. People need to know why your data matter.

• • • • •

That’s all for this month!

23 July 2021

Review: How Design Makes the World

Note: Author Scott Berkun recently announced to his email subscribers that he has had a medical event that has seriously affected his voice. This is a concerning set back for someone who makes a living in part by public speaking. I wish Scott well and hope he eventually return to public speaking. He has a list of ways you can help him at this difficult time.


• • • • •

How Design Makes the World delivers a big, serious subject in a short, breezy book.

Scott Berkun takes a very high level view of design. He is not interested so much in how to design in a nuts and bolts sense. This is more about general processes and, importantly, their impacts. Berkun asks early on, “Why are so many things seem to be badly designed?”

I appreciate that Berkun’s answer to that question acknowledges things like power dynamics and economics. People who might make good design decisions don’t necessarily get to make the decisions or get the resources they need to make them. 

For example, the borders of Middle East were drawn by mid-level bureaucrats who were not from the region. We have been living with the consequences of those decisions ever since.

That example is just one of many historical anecdotes in this book. Berkun has a good nose for finding these, and they are consistently interesting. And he casts a wide net. So while I have spent a lot of time thinking about graphic design on this blog, I learned a lot about other kinds of design. “Norman doors” are going to be part of my vocabulary forever now.

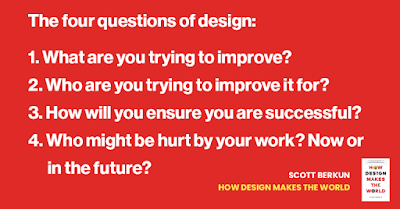
Is there anything here for a poster maker? Maybe. Scott includes four key questions to evaluate designs:

 
The four questions of design. 1. What are you trying to improve? 2. Who are you trying to improve it for? 3. How will you ensure you are successful? 4. Who might be hurt by your work? Now or in the future?
 

What are you trying to improve? Who for? How will you be successful? Who might be hurt by the work?

Let me take a stab at applying them to conference posters.

1. What are you trying to improve?

I see two things poster designers are often striving for. 

The first is efficient use off time spent making the poster. Berkun addresses that: “Efficiency is often taught to mean working in a straight line, but the trap is that efficiency is not the same as quality.“

The second is maximizing the information information content on the poster.

Why I think these are both dubious improvements lie in the answer to Berkun’s second question.

2. Who are you trying to improve it for?

People trying to minimize time on creating posters and maximizing information on posters are usually trying to improve those things for themselves, not other people.

3. How will you ensure you are successful?

I think a lot of poster makers don’t have an answer for that beyond having a supervisor say it’s okay. I don’t know how many people show off drafts of their poster or rehearse their poster presentation  to others before they head to a conference. 

4. Who might be hurt by your work? Now or in the future?

Luckily, posters are mostly harmless. The content of the posters might not be, but that’s another issue for a different blog. Perhaps a more helpful way to frame this question is, “Who might be left out?” Who might not be able to benefit from your data and insights because of how you have made your poster?

This book is not essential for poster makers. It’s not a “how to” and lacks the nitty gritty details that someone looking for concrete advice on graphic design might want. But if you are interested in stepping back and looking at that bigger picture, Berkun paints a rewarding view.


15 July 2021

Critique: Note-taking, or, “What did I just read?”

This poster is courtesy of Emily Goblirsch, presented at the Arizona Psychology Undergraduate Research conference (AZPURC). Click to enlarge!

Poster titled, "“What did I just read?”: Self-explaining and note-taking as different strategies for comprehension".

I like how the subject of the poster, writing and note-taking, is reflected in the design. But it does so subtly and never detracts from the main text. Some lines and circles recall looseleaf  paper, and a handwritten style typeface used for the title and headings (Ink Free). 

Ink Free is a little thin, and I might have looked for a typeface with a little more heft to it. The samples of handwritten fonts below show a couple that hold up a little better from a distance.

Samples of five handwritten fonts: Ink Free, Bradley Hand ITC, Ready for Anything BB, Letteromatic!, and Cavolini.

Because this meant to look handwritten, I’m not sure if the slightly off-center placement of the headings is intentional or not. The arrows is the except below are equal length.

"Results" heading off center in box.

When you are going for  a hand drawn look, it’s okay to have things imperfect. But if so, you want to do things to show that imprecise placement is clearly deliberate.

There are three main colours on the poster. There’s a tan for the heading and callouts, and red and blue in the diagrams. In both, red codes for “self-explain” and blue represents “note taking.” But despite representing the same things, the colours are not the same. The colours in the bar graph are notably brighter and more saturated than in the Venn diagram.

Here’s a remake with the colours made consistent.

Poster titled, "“What did I just read?”: Self-explaining and note-taking as different strategies for comprehension" with colours in figures made the same.

The fainter colours still hold up because the bars are large enough that they still read clearly from a distance.

The “Purpose” block might make more sense if it came before the “Methods” block. I think the main reason “Purpose” is where it is is because of how the the “Materials” blows out in a callout to the right, underneath “Purpose.”

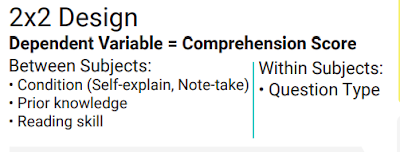
Speaking of “Methods,” Emily wrote that she disliked the top of the methods section.

Except from poster showing "2 by 2 design".
Emily wrote:

I find it crowded, especially the “)” next to the blue line. It was unfortunate though, because the only way I could edit it to look less crunchy was a smaller font, which would stand different from the rest of the poster's font size and format.

Crowding is one space is often alleviated by editing someplace else. For instance, I might look to recover space in the “Background” section. The extensive use of bullets (circles, and greater than symbols, and numbers) chews up vertical space for little benefit.

Speaking of bullets, I’m not sure why text in Venn diagram needs bullets.

But to return to the problem of the “2×2” design (which should use a multiplication symbol instead of a lowercase letter “x,” by the way), the methods might parallel how the data are shown in the results. Show it’s a “two by two.”


Self explanation Note taking
Text based

Inference based

The empty cells could include a prediction, like “Highest score predicted.”

Of course, if you show results in a table, what do you need the bar graph of the same data for? And vice versa. I would prefer to keep the bar graph and remove the table in the “Results” section. Not sure if the table in the methods would still work as well.

Emily also took advantage of the online format:

Since this was an online poster, I made it “interactive” by having the references hyperlinked to the actual paper I’m citing. You just have to click on the small numbers that represent the citations. I felt like it would be odd to have a whole section for references when it was an online presentation (and we had to do the poster format).

(The images of the poster here on the blog are not clickable.)

08 July 2021

Review: Better Data Visualizations

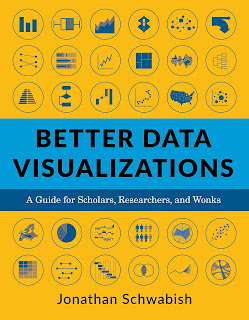
Cover to "Better Data Visualizations"
I ran across Jon Schwabish’s book, Better Data Visualizations, when my editor pointed out how uncomfortably close it looked to an unused cover design for Better Posters.

Once I finished smiling at the “separated at birth” similarities, I realized I should actually read Jon’s book because it was, as they say, “relevant to my interests.”

Better Data Visualizations is very useful.

The bulk of the book is a big ol’ list of different graph types. The charts range from the common (bar charts, scatter plots, and tables) to the more esoteric (Voronoi diagrams, Marimekko charts). It’s not quite an “encyclopedia of charts,” but it is thorough.

There are usually multiple illustrations (in full colour) of each type of chart so you can see them “in action,” as it were. Almost all the illustrations are in full colour.

Every entry has a series of tips of how to avoid pitfalls and maximize the effectiveness of that particular chart type. I particularly appreciated the concise guidelines for making tables presentable. 

Readers of this blog who work in the humanities occasionally ask about techniques for their fields. If that is an interest of yours, you’ll be pleased to know Schwabish has a section on qualitative visualizations. It is slimmer than the section on quantitative visualizations, but given that this is an area that is often ignored completely, this is an extremely welcome addition to this book.

There is a section showing “before and after” revisions of charts that is quite fun.

Lastly, there is a section on developing a style guide. While this is aimed at organizations that make a lot of charts, I realized that it could be extremely helpful for a poster maker to draw up a short style guide for their poster. One of the biggest problems I see on posters is inconsistency. This is usually because people use different software tools for different parts of the poster, and they don’t check to harmonize the graphs and the rest of the poster.

While I was reading, I was wondering, “But how could someone know how to make some of these non-standard charts?” While the appendices are often considered to be extra material that can be removed, the appendix on data visualization tools was extremely helpful for me. (“Microsoft has a graphing site called Charticulator? Cool.”)

Because data visualizations are often the heart of conference posters, there is definitely some overlap in Jon’s book and mine. But Better Data Visualization covers much more territory there than mine does.

External links

PolicyViz

Related posts

Solving the Pokemon problem for posters


06 July 2021

The world’s best data visualizations are a team effort

I was recently listening to an older episode of Jon Schwabish’s PolicyViz podcast with Edward Tufte. Tufte’s books influenced a lot of my thinking about topics here on the blog. I cite some of his analyses in the Better Posters book.

In the interview, Tufte praises scientists for data visualizations. He specifically name drops the journal Nature and says something like, “Nature has the best data visualizations in the world.”

Now, in the course of writing this blog and seeing many data displays produced by scientists, I can say that my impression is that — even for researchers at the top of their game — scientists do not routinely make graphs that would be described as world leading. Many, if I may be blunt, are mediocre. (But not yours, my dear reader. Yours are great. 😉)

So as I am prone to do, I asked on Twitter. And several people confirmed that Nature journals do not necessarily take figures as submitted. Instead, they have an in house team that redraws figures to meet the journal’s house style.

This is important, because so many scientists are resistant to anyone changing their work. A significant derides this kind of polish as unnecessary. (The No Name design philosophy.) They disparage the claim that journals “add value.”

(Of course, when journals pull back on design and only deliver the content, someone will be grumpy about that, too.)

We should not pretend that the world leading graphics that many admire are a natural outcome of scientists grappling with intricacies and complexities presented by data. Will that help? Sure. But let’s give credit to the uncredited: the designers who quietly improve graphs without even asking for co-author credit.

To paraphrase a sports cliché, “There is no ‘I’ in ‘data.’”

P.S.—Tufte, I think it’s fair to say, has a reputation for being extremely self-confident and sometimes a little prickly. But if so, this interview finds him in a much more genial mood. 

External links

PolicyViz Episode #21: Edward Tufte 

Beautiful Evidence reviewed

02 July 2021

The 2021 #BlackInX poster winners

One of the good things that emerged in 2020 was a series of grassroots Twitter events highlighting the achievements of Black scientists. Recently, these combined forces for a #BlackInXConference online. And there was a poster competition on Twitter!

Here are the winners. Click any to enlarge! Click the Twitter handle for the thread describing the poster.

Cellas Hayes (@c3llas):


Poster titled, "Neuroendocrine modulation alters cellular function In the neurogliovascular unit and learning and memory in vivo"

Caprice Phillips (@CapricePhillips

Poster titled, "Detecting potential biosignatures in gas dwarf atmospheres with the James Webb Space Telescope"

Lashanda Williams (@DrCoolSci):

Poster titled, "Multidisciplinary support for yoga as a part of a sustainable self-care practice for academics"

 Congratulations to all!

01 July 2021

Put your favourite data in the spotlight

Recently, I talked about how data sets like this are very hard to turn into posters:

Series of many Western blots

Projects like this are usually better as a slide talk, where each panel can be on an individual slide.

But you don’t always get your preferred presentation slot. There are just not enough slide talks to go around in many conferences. 

As solution is to figure out which data are the most important, and highlight those.

I know, I know. We are supposed to be like parents to our data, and we are supposed to love all our data equally. Many researchers strive hard to “democratize” their data, whether it’s by refusing to show a bar graph and opting instead for some sort of scatterplot, or by thinking that it doesn’t matter which value you show in a binary choice. (These are both arguable positions.)

But in many cases, when you run many experiments, there are going to be some results that are clearer than others. Or that are clinching experiments that demonstrate cause. Or is closer to a predicted value. If you have one of those, don’t treat it like all the other data.

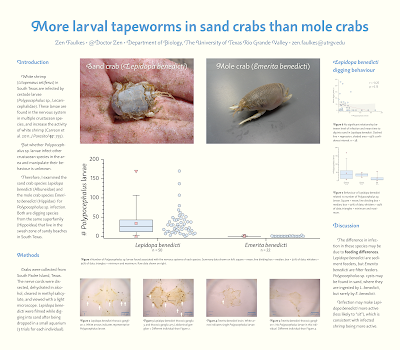
This is one of favourite posters of mine (I’ve shown it before). Click to enlarge!

Poster titled, "More larval tapeworms in sand crabs than mole crabs" with large box plot in center.

Right in the middle is a box plot comparing numbers of parasite in two difference host crab species. One species is almost always infected, and the other is almost never infected. 

Those are not the only results on the poster. There are more graphs in the right column. But the size and placement is absolutely intentional, because the data were just so clear. You don’t get such sharp, clear, clean differences all that often. 

So I made it big. Size is an easy way to signal importance.

(In retrospect, I might have made that box plot higher contrast.)

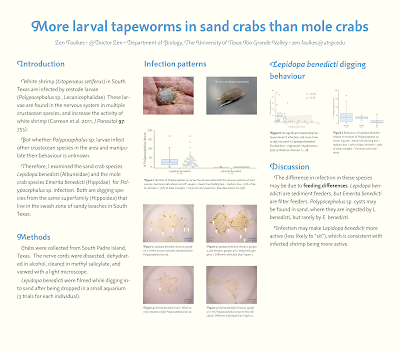
Here’s a quick mock-up of what the poster might have looked like if I just decided to treat every bit of information equally.

Poster titled, "More larval tapeworms in sand crabs than mole crabs" with all plots the same size.

I don’t think the poster is anywhere near as strong visually. I’ve ended up with more gray blocks of text and less imagery.

Moreover, it’s arguably less helpful to a reader. Even though the text and data are the same, the information presented in the poster is different. 

Layout contains information. The size you make something on a poster contains information. By making everything the same size, a reader has to do much more work to extract what on the poster is important.

Make that hard editorial decision. Decide which experiment, which data, which plot, matters the most. Then make it clear visually that it matters the most.

Happy Canada Day! 🇨🇦