30 July 2020

Link round-up for July 2020

The Journal of Biogeography has an article from its editors about how to make a great figure. heir take-home messages:
  1. Create introductory figures to set up your problem.
  2. Create figures at final size.
  3. Use vector graphics. (Emphatic agreement here!)
  4. Make figure captions understandable on their own.
  5. Don’t overuse colour.
  6. Use maps to show geography.
  7. Include node support in phylogenies.
There are no figures in this article (!), although it links out to several other articles for figures.

• • • • •

Green charts
This is a good blog post on choosing colours. In particular, it considers the problem where you are give a style guide and told, “You must use these particular colours, because that’s our brand.”
At one organization I worked for, before I created a data visualization style guide, the guidance for charts was to “use brand green.” This meant that all charts were green, no matter what data they represented. It was hard for readers to tell the difference between graphs in a report, because they all looked the same. Green. To show the complexity of the data, we needed more colors.
Your institution’s colours were probably picked by how they’d look on a t-shirt and not how visible they will look on a graph.

• • • • •

Cumulative graph of sup[erhero sightings in neighbourhood
This is a good post on how to make graphs more understandable. Excerpt (which was highlighted as “Important!” in the original):
If you’re going to show people a cumulative graph, it’s important that you tell them it’s a cumulative graph.
• • • • •

Defaults are risky. At least this article on typefaces for research manuscripts suggests so. Because a lot of people do not like Calibri.

• • • • •

A history of emojis from 1862 (!) to today. Some fun tidbits in there, like the role of AOL (remember them?) has by introducing buddy icons in the messenger app.

• • • • •

How did Georgia hide a huge increase in COVID-19 cases?


Map on the left is 2 July 2020. Map on the right is 17 July 2020. Check the legend carefully.

That said,  Jonathan Schwabish offers a counterpoint here. Excerpt:
I believe that the issue of the changing legend is likely due to how the data visualization tool (whatever it is) automatically sets the map bins based on the data.
This is a Hanlon’s razor argument. I used to invoke Hanlon’s razor much more often, but living through 2020 has all but blunted that razor for me. I’ve seen far more heartlessness than cluelessness this year.
• • • • •
This post on the billboard poster format proposed by Mike Morrison is from last September. Excerpt:
I had the most “traffic” at my poster than ever, especially from a more generalized audience. In the past, most of the people who have visited my posters were specialists who picked out keywords from my poster title and were working with the same organism. With the main takeaway of the poster front and center, I also met people who were interested in my methods and intermediate findings and the applications/implications for broader research.
Sorry I missed it then! 

27 July 2020

#PlantBio20 is this week!

Plant Biology 20 banner

A quick reminder that I will be speaking at Plant Biology 20 this Wednesday, 29 July!

Plant Biology "Get Your Message Across" workshop

Wednesday, July 29, 2020, 1:30 PM – 2:30 PM EDT

Get Your Message Across: A Guide to Artwork and Illustrations for Better Impact and Clarity

Speaker:  Magdalena M. Julkowska, PhD – KAUST
Speaker:  Patrice A. Salomé – UCLA
Speaker:  Zen Faulkes
Chair:  Ivan Baxter, Ph.D – Donald Danforth Plant Science Center
Chair:  Mary Williams

Update, 9 August 2020: An archived version of the workshop is now online here. In particular, all the speakers went through the chat transcript and added many more comments to the questions, many of which we could not answer live during the session.

23 July 2020

One simple trick to improve (some) bar graphs

I ran across this figure because it was being used as a good example.

redictive power (root  mean square error: RMSE) of edaphic  (dark grey), topo‐climatic (pale grey) and  overall (white) predictors calculated on the  diversity of protist operational taxonomic  units from the overall community and nine  broad taxa retrieved from 178 meadow  soils in the Swiss western Alps. The RMSE  were calculated on 100 cross validation of  Generalized Additive Models performed  with 20% of the samples as test dataset.  The letters on the top of the boxplots  represent significantly different groups  according to a multiple comparison mean  rank sums test (Nemenyi test p < .05) for  each of the edaphic, topo‐climatic and  overall variables


This is a journal figure, not a poster figure, so there are many things I would want to do differently on a poster. But I just want to focus on one thing:

The most important things to read on this figure are the labels on the x-axis. You’re probably crooking your neck right now trying to do so. Readers should not have to contort themselves to read your graph.

For that matter, the all the y-axis labels also require you crook your neck read them. Even the numbers, which have no business having their being vertically aligned.

But luckily, the solution is simple: rotate it!

redictive power (root  mean square error: RMSE) of edaphic  (dark grey), topo‐climatic (pale grey) and  overall (white) predictors calculated on the  diversity of protist operational taxonomic  units from the overall community and nine  broad taxa retrieved from 178 meadow  soils in the Swiss western Alps. The RMSE  were calculated on 100 cross validation of  Generalized Additive Models performed  with 20% of the samples as test dataset.  The letters on the top of the boxplots  represent significantly different groups  according to a multiple comparison mean  rank sums test (Nemenyi test p < .05) for  each of the edaphic, topo‐climatic and  overall variables
Suddenly, this graph becomes easy to scan. No information is lost. The data is not harder to compare. And by definition, the graph takes up the same amount of space on the page. Some tweaking might be required to optimize to columns widths, though.

There are a couple more changes besides rotating the entire image. The old y-axis scales are on the top with a simple rotation, and those got moved to the bottom. The legend and the comparison letters, which were the only things oriented horizontally, got “unrotated” back to horizontal.

If your labels are too wide to be horizontally aligned, consider turning your vertical column graph into a horizontal bar graph.

You don’t want to do this in every case. If you are plotting time as a variable, it is almost always better to keep time on the x-axis, because that is such a standard way of portraying time in graphs. Fortunately, you can often use abbreviations for time (“Jan” or even “J” instead of “January”) to avoid vertical text.

I can’t help you with those taxonomic names, though.

And the moral of the story is: English text wants to be horizontal!

Reference

Seppey CVW et al. 2020. Soil protist diversity in the Swiss western Alps is better
predicted by topo‐climatic than by edaphic variables. Journal of Biogeography 47:866–878. https://doi.org/10.1111/jbi.13755

16 July 2020

Review: DesignCap


Having reviewed a couple of online graphic editors this month, I got an email from a company, DesignCap, asking me to do a third. I created an account and logged in.

Wow, it’s a lot like Canva (reviewed last week, here). The user interface, the templates... these two services are clearly trying to occupy the same space.

Lots of features are locked for paid membership. You can only save five designs at a time. You are limited to five image uploads (that would be a big problem for many posters). You can export to JPG but not PNG or PDF. You can only expert in “Small” size.

Some features are missing entirely. There is no “space evenly” button, paid or not.

I try a poster template. They are all 420 by 594 mm (16.5 by 23 inches). That’s really the size of a flyer to me. Too small for a conference poster.

I tried to create a poster to a custom size. Hm, can’t enter size in inches, only pixels. And the maximum number of pixels is 4,000. Too small for a conference poster.

DesignCap can’t make a conference poster. We’re done here.

09 July 2020

Canva review

Canva logo
TL;DR: Canva is great for simple things like an Instagram post, but I would hesitate to use it for a conference poster.

In January (before we knew that 2020 would be a dystopian hellscape, remember?), one of my contributors mentioned making a poster in Canva. I’ve been playing around with it on and off since then, and am here to report what I've learned.

Note: All my comments are based on the free version of Canva. There is a Canva Pro that you pay a subscription fee to use.

One big advantage of Canva is that this is a cross platform app. I suspect many people will run it in a desktop web browser (which seems to be its native form). But there’s a desktop version. There are tablet and smartphone versions for iOS and Android. With an account, your work is stored online and accessible from all your different devices.

This is nice, because it means you can sketch out designs away from your desk. You can tinker with a project standing in a socially distanced line to deal with the cable company.

The big selling point, I think, is the templates. I’ve been using Canva mainly for creating Instagram posts. Here’s one I made to promote a post from a couple of weeks ago:


This was derived from a haphazardly picked Canva template, removing the text, and replacing it. For quick, small, simple things like this, I like Canva a lot.

For more complex tasks like a poster, I like it less. When you look for a poster template, the size is 18 by 24 inches. Too small for a conference poster. You can create a custom size, as long as it’s smaller than 64.5 by 38.7 inches. That is smaller than I would like, but given that many conferences seem to be trying to squash posters into smaller and smaller space, it may be all you need.

Typography is a critical point for any poster. Navigating the font selection is challenging. First, fonts you use on your desktop are not on the Canva list. No Times Roman, Arial, Gill Sans, Helvetica.

Second, the list of fonts you have is kind of huge. Forget trying to scroll through them all to find one you like.Your best bet is to search with a term like “serif,” “slab,” or “semibold.”  How these are tagged is not clear to me. I’m not sure what makes these “decorative.”

Decorative fonts in Canva

Even with a search, you are often still presented with a damn long list to scroll through.

You can upload pictures from your computer (such as graphs, etc.). But there is no serious integration with standard desktop products like Microsoft Office. You can’t upload an Excel spreadsheet and get a graph from it. You will need to make a PNG, JPG, or SVG file to import into Canva.

You cannot create guidelines. Instead, there is a lot of automatic “snap to” features that help align elements. You can also space elements evenly by selecting multiple objects.

You can create a grid, but only sort of. You click “Elements” in the left sidebar, and search for “Grid.” You don’t get a grid in the usual sense of a series of lines diving the page. Instead, you get another template that divides up the page and lets you “drop” elements into those spaces.

Here is an image with a three column “grid” with pictures dropped in.

Three side by side images in a square. The images reach top to bottom.

You can resize the grid, and it resizes everything within it giving different crops.

Three side by side images in a square. The images do not reach top to bottom.

Notice that hairline space between elements has stayed the same. I can’t see anything that allows you to set margins between elements.

As far as I can tell, you cannot set anything in Canva to a certain size. You cannot easily take an image and force it to be six inches wide, say. For an Instagram post with maybe two to four elements, that’s not a problem. For a conference poster with maybe dozens of elements, that’s a problem. You may want to make sure all your text boxes and graphs are five inches wide, for example. That’s very difficult in Canva.

Related posts

Critique: Dangerous LDL

External links

Canva

08 July 2020

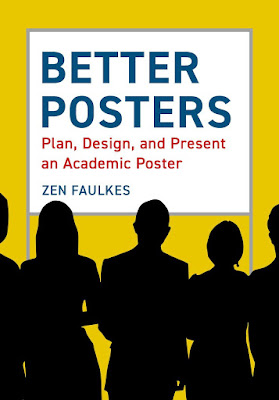
Better Posters book cover reveal!

Look at this!

Better Posters book cover

The Better Posters book has moved another step being closer to reality, a blogger’s dream you can hold in your hands!

Current publication target: 25 January 2021!

Read more on the Pelagic Publishing website!

02 July 2020

Vectr review

I often use Pixlr as a quick online photo editor, and recently noticed a new product, Vectr. I was intrigued because it made vector based graphics. (If you don’t know what those are and why you should use them, here’s a post that explains.)

I tested out Vectr by trying to make a version of my new blog heading.

I soon noticed was that picking typefaces from the dropdown menu was a nightmare. Because this is an online app, you can’t add new fonts. You take what you’re give. Fortunately, there’s a huge variety of typefaces, but unfortunately, few familiar ones. You can’t filter for “serifs” or start typing a name. You have to scroll down laboriously. You want a substitute for Times New Roman? Happy hunting.

In Firefox, the name of the typeface was duplicated, once in a plain sans serif and a second time in the typeface itself. It was near impossible to read and know what you’re getting.


I thought that couldn’t be right. On a hunch, I opened up and tried Chrome. The typeface list was displayed correctly.


(Aside: I am deeply annoyed that we’ve had web browsers for over twenty years and I still run into pages that render differently on different browsers.)

You can pick colours for everything, but you either need to be happy with eyeballing the colour or work out a hex value. You cannot input RGB or CMYK values directly. And I didn’t see the “Recently used” button did anything.


You can import images in several formats, both pixel based (*.jpg and *.png) and vector based, including *.svg, Adobe Illustrator (*.ai) and *.eps. By the way, the import of an *.svg file I tried was more accurate than CorelDraw 2020.

You get a much more limited range of export options, though. Just three: *.svg, *.jpg, and *.png. It is a bit weird that this bills itself as a vector based illustration program and two of the three export options are pixel-based.

Some features, like alignment, are buried in “right click” menus rather than being visible on the main page. In fairness, I did not run through the tutorials.

The end result of my tinkering:


Not horrible, but I could not duplicate some elements I had created in CorelDraw, notably the shape I used for “Soon to be” and the strike throughs.

Related posts

Will it scale?