
So it is only appropriate that today, conference posters are having a moment.
• • • • •
Mike Morrison’s billboard style poster has done the seemingly impossible. It turned academic conference posters into national news.

First, it was on NPR. Excerpt on what problem this design is trying to solve:
“A poster session, ideally, is this incredibly fertile ground for creative insight,” says Morrison, who met me at the annual meeting of the Association for Psychological Science in Washington, D.C. “You’re walking into a room, completely open-minded, and ready to hear and read findings around stuff that you didn’t even study before. If there are 50 posters here, it should transmit 50 new insights into your brain.”
Then the Matthew Effect kicked in, and more coverage ran in Forbes. Except:
(M)ost communication between scientists involves tedious levels of detail, to ensure that their colleagues have enough information to replicate the work. A conference presentation doesn’t have that same purpose.
Thanks, Forbes, for reminding us how boring we are.
Then EdSurge. Excerpt:
Rankyung Hong, a PhD student in computer science at the University of Minnestoa, said the new design is probably “more ideal” than the traditional template. But she admits she will probably continue to fill all the available space on her research posters with findings and detail about her research. “It’s very complicated material,” she says of her research. Plus, she says, presenting as much information as possible is “the norm in our department.”
And Inside Higher Education got in on the act, too. Excerpt:
Trauth said that he supports a movement toward better posters, "in principle." In his graduate course on science communication, for example, he asks students to review 10 posters and guess which won awards. There is a typically little consensus. In reality, all have won some kind of award and none, in Trauth's estimation, is really great. That's in part because awards tend to assess content, not design, he said.
Most of this month’s link round-up consists of reactions and discussions about Morrison’s format, largely prompted by the NPR coverage.
(Aside: Having run this poster blog for ten years, it feels weird to be suddenly documenting a controversy.)
• • • • •
Derek Crowe has a thorough post analyzing the billboard format and suggesting some alternatives.

Morrison called the billboard format the “better poster”, so Crowe calls his “butter poster.”
(“Better” is a hard name to top, so I went with Butter)
One of the key pieces of information that Derek provides is some data on how long people are willing to spend at a poster:


About two thirds of people want to spend five minutes or less at a poster.
This sort of detail makes this not only one of the best weighing of the pros and cons of the billboard poster, but one of the best articles about conference posters I’ve read in a while. Derek is still working on this, and has a set of follow-up notes that are also good.
Recommended.
• • • • •
From Derek’s notes, I was led to this article by Echo Rivera about conference posters. This is another great post (some of which aligns with some of my own opinions). Excerpt:
3 things I LIKE about #BetterPosters
(1) It’s changing minds & waking people up about how bad conference posters are.
The #1 biggest struggle I face when trying to get academics and scientists to design better presentations is that most people think their slide design is much better than it actually is. And I’m not saying that as a judgmental snob. I’ve lost count of how many people have come to one of my presentation training workshops thinking they’ll just get a couple “quick tips” but walk away realizing their entire approach needs to change.
She also lists five things she doesn’t like about the billboard format. She also warns against any conference ever mandating any template.

This is another one of the best posts on conference posters I’ve read in a while. Also recommended.
• • • • •
Colin Purrington has one of the longest running resources on poster design out there (predating this blog), and he offers his thoughts in this Twitter thread. Excerpt:
The #betterposters push is in part a desperate plea for a reset. I also like that he’s pushing experimentation to see whether it’s actually better. Hopefully that will involve randomly assigning poster presenters to treatments. That would be, um, very entertaining.
Colin raises one important point that I haven’t seen explicitly stated elsewhere:
One technical matter that makes me cringe is that the #betterposter model encourages visitors to take photographs of posters (to activate QR code). Posters often have data that is not published and presenters don't want photographs taken. Some conferences even forbid it.
The Society for Neuroscience was one big holdout for years is forbidden poster session pictures. But nobody followed their rule, and they are repealing it this year.
• • • • •
Meanwhile, Lorna Quandt polled people to see what they thought of the billboard style poster.

Most people liked parts of it (45%), but at the edges, the haters (27%) outnumbered the supporters (17%).
• • • • •
Lorna’s results are echoed in a thread by Amy Cheu. Excerpt:
I really dislike the proposed new “conference posters”. From a #SciComm view, I think it’s ineffective. From a graphic design perspective, it’s incredibly ugly. Posters are supposed to be conversation starters, nothing to talk about when there’s nothing on the poster.
Cheu is also quoted in the Forbes article:
“Every example or use I have seen so far has continued the trend of text-heavy, graphic-poor posters. Only now, the text is smaller and smashed into the corners of the poster.”
Hat tip to Rachel French.
• • • • •
And another Twitter thread on the billboard format by Cecile Janssens. Excerpt:
I don’t want to consume a conclusion, but be given enough relevant details about methods, statistics, and results to invite a conversation.
Hat tip to Giulia Liberati.
• • • • •
Roger Giner-Sorolla makes a similar point:
New style poster, intellectually arrogant version: POGO STICK JUMPING INCREASES SELF-CONTROL.
Intellectually humble version: In 3 studies, N = 320 US undergraduates self-reported higher self-control after pogo stick jumping for 1 min.
• • • • •
And Mark Piefer writes:
It’s anti-scientific, asking you to boil things down to an over-simplified conclusion.
There’s good discussion in the thread arising from Mark’s initial post. It’s a good window into people’s assumptions and ideas about what poster sessions are and should be. There is a wide variety of opinions on display. For instance, Erin Williams made this counterpoint:
I find large poster sessions can be info overload & this format would help me quickly decide if I wanted to know more, in which case I’d find the abstract, talk to the presenter & scan the QR code for full details.
I also think Gregory RSL hits on something important:
This idea was designed to meet a goal that I don’t have: extract every conclusion from every poster in the room. I never have that goal and I’m not sure anyone should.
The key design point that Gregory makes is that how you design something depends on what you think the user’s goal is (or should be).
Some audience members want to read the abstracts in advance, pick a few posters to visit, then do a few deep dives on a couple of projects. If that is your goal, it doesn’t matter if your poster is a wall of text or not. The billboard format does not help you.
Some audience members want more of a “core dump” where they can get something quickly from many posters. Then, they might follow those up with more conversation. This is what the billboard poster style is explictly meant to do.
Different people are going to have different ideas about what they want to get out of a poster session. And that’s okay. But different designs are going to meet their viewing needs.
Hat tip to Milton Tan.
• • • • •
Garr Reynolds, author of the Presentation Zen blog and book (and a major source of inspiration for this blog), is positive about the billboard poster format:
Yes. First you want to get people’s attention, then bring them into your poster. Well done!
And:
Fantastic, Mike! Well done!
• • • • •
Matt Crump uses the billboard poster format for over 30 great jokes. Go to the Twitter thread for all of them! Here’s one:

Hat tip to Lorna Quandt.
• • • • •
Virginia Heinen also used the format for fun:

Hat tip to Dani Rabiotti.
• • • • •
Hilda Bastian asks why the visualization of our methods lags so far behind the visualization of our results. She uses this example of a clinical trial flowchart:

She notes:
Conference posters are a great place to experiment with diagrammatic representations, and there must be lots of great examples.
Having looked at lots of conference posters, I can say that there are not a lot of great examples. Alas. The problem is PowerPoint. Because PowerPoint is the default poster making program for many academics, that’s what people use to make flowcharts. And the PowerPoint flow charts aren’t very good.
• • • • •
Wendy Nather has a demonstration of the power of visual hierarchy.

Hat tip to William Gunn.
• • • • •
Free fonts! K-Type has some awesome free fonts for you. Seventy free fonts, to be exact.

They are meant to be samples for their wider font families, but you can get a lot of mileage out of their free samples.
• • • • •
Martin Kyzwinski has some suggestions on plotting data. Click to enlarge!
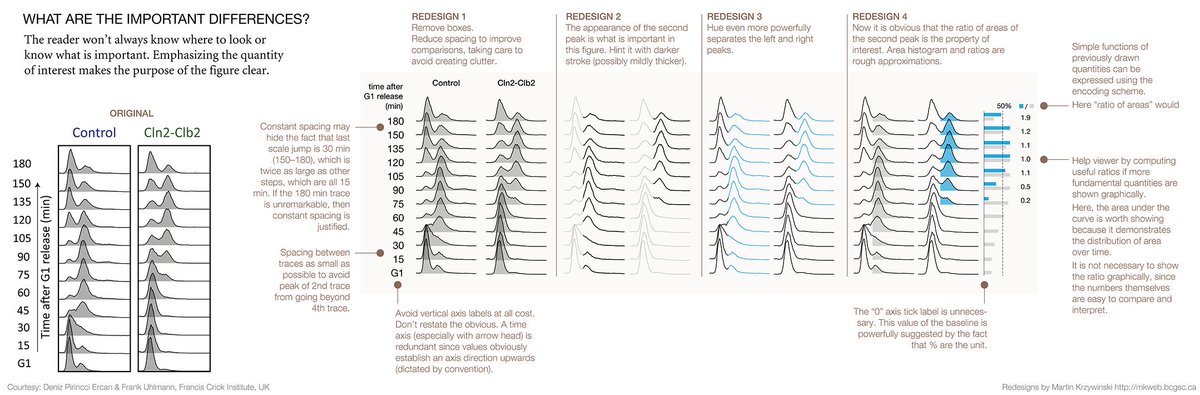
Martin’s Twitter feed is full of good tips. Hat tip to Damien C-C.
• • • • •
Graphic design. Play the game! This is an interesting game called “Can’t Unsee” that teaches design. You’re shown two comparable images and asked which is better.

It can be challenging! Hat tip to Garr Reynolds.
• • • • •
The Evolution meeting has some awesome guidelines for presenting a poster (PDF). Lots of conference have poster presentation guidelines, so what sets these apart? They specifically address how to present a poster in an inclusive way. They consider wheelchair users, people who have interpreters, people who may not be able to see well, and so on.
• • • • •
A paper on how to make better conference abstracts and presentations:
Foster C, Wager E, Marchington J, Patel M, Banner S, Kennard NC, Panayi A, Stacey R, The GPCAP Working Group. 2019. Good practice for conference abstracts and presentations: GPCAP. Research Integrity and Peer Review 4(1): 11. https://doi.org/10.1186/s41073-019-0070-x.
Section 3.2 discusses posters.
• • • • •
Speaking of how to make poster sessions better, Matt Garcia says, “Give people some space!”
The current paradigm among conference organizers for poster sessions is approaching broken. Too-small rooms, too- narrow aisles (certainly not accessible if you're on crutches or in a wheelchair), and way too loud. Lots of crowded communication, but only by shouting.
Hat tip to DrugMonkey.
• • • • •
Kylie Hutchinson did not have a good poster experience with this poster:

She describes what she learned here. (Aside: I like some of the elements here, but I’m not sure what the sticky note swarm in the upper right is supposed to convey.)
• • • • •
Speaking of bad experiences, Casey terHorst wrote:
I don’t know what your name is, but to whomever chewed out the undergrad in our lab giving her first poster last night and told her she didn’t belong here, please quit science #Evol2019
Do not be that person. Do. Not. Knock that shit off.
• • • • •
And that wasn’t an isolated incident. Catherine Sheard reminds everyone that conferences are sometimes attended by horrible people.
I have had a series of extremely negative conference interactions over the past few years.
And I’m not talking awkward misunderstandings or borderline slights; I’m talking the total stranger who came up to me at Evolution and told me I didn't deserve my PhD. ...
My colleagues of colour all have stories about how conferences are especially difficult for them. My trans and non-binary colleagues all have stories about how conferences are especially difficult for them.
I don’t want to explain my dietary requirements, thanks, because a surprising number of strangers seem to think that a biology degree makes them qualified to assert that my doctors must be wrong and/or I must be lying.
I get it. I really do. It’s small talk. People blurt out all sorts of strange things while trying to make small talk. But, uh, that food thing that you’re joking about could kill me, and getting even joking death threats from senior people in my field isn’t cool?
Your female colleagues, your colleagues of colour, your disabled colleagues, your LGBTQ+ colleagues, your colleagues who are any intersection of these categories thereof – they’re at conferences for the same reason you are. To present their research and to hear about yours.
So let's treat our colleagues with respect, okay?
And even better, let’s try to intervene when necessary (major kudos to the colleague who immediately defended me to the person who thought I didn’t deserve my PhD) and work to make conferences generally more inclusive.
I say again: knock that shit off, people.
• • • • •

The Smithsonian Museum is in a quest to digitize a huge collection of political posters.
The Smithsonian said it hopes to have the new images available online by late summer and, with the help of Google’s Arts & Culture program, broaden the project’s reach and sophistication.
Hat tip to Merilee Proffitt and David Shiffman.
• • • • •
Some smaller conferences are letting people promote their posters in talk sessions. Colin J. Carlson showed someone who took a few seconds of poster promotion on stage and made it remarkable.
Hat tip to Milton Tan.
• • • • •
I respect the hell out of science journalist Elizabeth Pennisi, who regularly writes about biology for Science. One of her pieces of advice for scientists on how to get news coverage?
Have on hand a compelling set of visual media – videos, photographs, artwork – to accompany your research. In today’s visual news environment, not having eye-catching imagery can be the difference between coverage and no coverage of your work.
Notice that she did not say “graphs of data.”
Hat tip to Alex Wild.
• • • • •
This one is hard to summarize, because it’s a disparate group of tweets that revolve around this graph (this image from Dave Baltrus).

Posting that led to a lot of discussion about what test could show those two distributions were different. Kevin Mitchell does a longer thread about the paper (which apparently suggests autism is related to the microbiome), saying here that:
I know they have p-values attached to them, but they don’t pass the eyeball test...
Now, when I wrote a blog post about judging stats by eye, I got some pushback from people who harrumphed and said, “This is why we have statistics.”
Well, J.J. Emerson ran the stats.
Unsurprisingly, not significantly different with either Wilcoxon or t-test.
Thomas Lumley dug deeper, and seems to have found how they tested the data sets.
They fitted a model with no correlation structure but with different variances for each Donor. Which, in the phrase of a colleague of mine, is not international best practise.
Regardless, a lot of the commentary showed some interesting ideas about statistics. In particular, it’s important to know that real but small effects are detectable in large sample sizes with a lot of overlap.
My point (and I do have one) is that all of this re-analysis, commentary, and a little handwringing were all brought about because of a visual image. If these data were described in a summary table or text, it’s less likely that it would have gathered as much attention as it did.
Pictures are the best form of communication.
• • • • •
While trying to attend a conference, Jason Chow flew to the wrong place. The wrong city. In the wrong time zone.
Booked flights and hotels in a rush, both are Canadian cities I’ve never been to that sit nicely on the south side of a river and have similar looking night-time pictures of their respective Westins. In hindsight, I got Calgary and Carleton (the university where the conference is) mixed up in my head.
At least he got the country right. If he had just remembered “Carleton,” he could have ended up somewhere in England.
• • • • •
And let’s wind up this epic link round-up with Melissa Ingala:
When you’re preparing to give talks and posters on data you have yet to generate:


