28 January 2021

Link roundup for January 2021

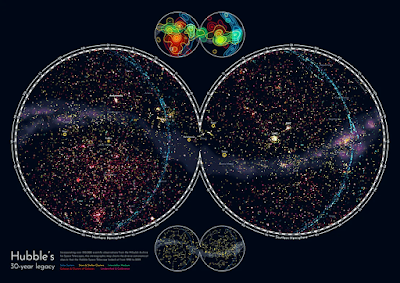
Let’s start the year with this awesome interview with Nadieh Bremer. Nadieh has created very intense, high data density visualizations. For example, check out her plot of astronomical 🌗 data. What started as an illustration turned out so well it has become a for sale poster.

Sky map of Hubble space telescope 30 year legacy


Nadia routinely works with huge datasets, and this article is a great look into her process. Excerpt:

“The reason I only create very rough outlines at the beginning is that data visualization stands and falls with the data itself,” Nadieh points out. “You can have a great idea but when you plug in the data it sometimes doesn’t work at all, because of outliers in the data or other quirks that you hadn’t considered during the design process. When you work with big datasets, you can only guess at the start.”

 Hat tip to Anneli Joplin,

• • • • •

Windows users, did you know pressing the “Windows” key and a period in combination brings up an emoji menu? Now you do. You’re welcome.

• • • • •

That’s all for now!

25 January 2021

Data isn’t math: Narrative stances matter

You have a survey that asks people, “Yes” or  “No.” 

These are two mutually exclusive categories. There is no third option, like “Unsure.” Therefore, if you know that 35% of people picked “No,” you know that 65% of people picked “Yes.”

The math is irrefutable. The math is trivial. So it doesn’t matter which value you report, right?

Well, no, as the American network ABC found out over the weekend. The network tweeted:

Tweet by ABC reading, "JUST IN: Roughly one third of the country opposes Pres. Biden's decision to recommit to the Paris Climate Accord and rejoin the World Health Organization, driven by steepened".

JUST IN: Roughly one third of the country opposes Pres. Biden's decision to recommit to the Paris Climate Accord and rejoin the World Health Organization(.)

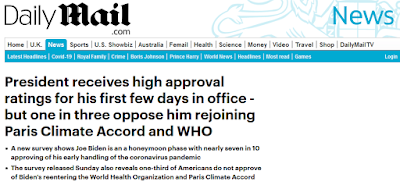
This generated a huge amount of pushback, and the tweet was deleted. There is still a news story on the main website, but the “one third oppose” made its way to the UK newspaper The Daily Mail.

Daily Mail article reading, "President receives high approval ratings for his first few days in office - but one in three oppose him rejoining Paris Climate Accord and WHO"

President receives high approval ratings for his first few days in office - but one in three oppose him rejoining Paris Climate Accord and WHO

So even though it’s simple math – if one third opposes, then two thirds support – putting the nos in the headline treats the opposition as though it were the important thing.

But a bloody awful lot of people online looked at that and said, “Two thirds support is huge, especially considering that there is so much polarization in America that the country just narrowly avoided an armed insurrection n January 6, 2021.”

Maybe the one third opposition is the right thing to emphasize. But then again, maybe not. Is it high? Is it low? Is it likely to go up or down?

I often see scientists who work with data trying to treat every single data point as though it were no more or less important than any other data point. (I think of this as trying to “democratize” data. Maybe not the perfect analogy, but I like the alliteration.) I think that they are so used to transforming and analyzing it that they think of data as math.

But this example shows how choices about presentation dramatically shift the emphasis, and therefore, the implications that people take away from it. Data are supposed to help be a way to understand the world, and we are always looking for how they fit in cause and effect relationships.

17 January 2021

Critique: Chromatic numbers

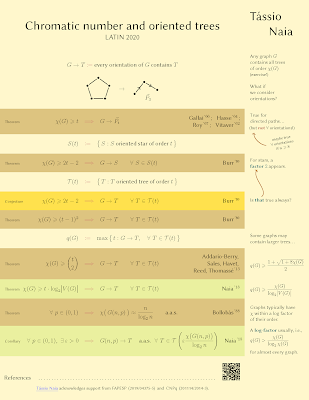
Today’s contribution is from Tássio Naia. It was recently presented at the 14th Latin American Theoretical Informatics Symposium. Click to enlarge!

"Chromatic number and oriented trees" poster

I’m pleased to have a poster than leans more towards the math side of research, because I don’t see a lot of contributions from that field!

For equations, careful typesetting matters. The alignment of the central symbols is well done here. 

The banding to emphasize the different equations also works. It seems the idea is to distinguish “Theorem,” “Conjecture,” and “Corollary.” I do wish the “Corollary” didn’t share a colour with a “Theorem” band (two above it). Presumably the idea was to prevent three rows of the same colour.

Tássio was nice enough to not only send the poster, but a little explanation of how it came to be.

There was little information about how the poster was going to be viewed (other than “it will be read on a screen”). Because of this, I did not worry about using a darker background color, or about using small margins.

I also considered that it would be easy to reach me even outside of poster presentation time-slots, since you can search for people by their name and open a chat window.

I went for very little text, even though that meant that statements were more on the symbol-heavy end of the spectrum (hopefully not too much).

For online posters, a portrait format works well because scrolling down is easier than scrolling sideways. Similarly, a single column works better than multiple columns because you don’t have to scroll back up to the top.

Because downward flow is expected, the arrows in the sidebar threw me.

Three sequential text blocks connected by upward pointing arrows
We expect arrows to lead us in a sequence, but both break the expected reading conventions. I think they would make much more sense if the arrowheads were on the other end of the arrow.

I like the feel of the main column being the formal presentation. The smaller lefthand column feels like marginalia. In particular, the slant on “maybe true” gives the side text an informal feeling I like. I would have been tempted to set the lefthand column in a good handwritten font to push that feeling a little farther.

Something that the image file here on the blog can’t show is the use of links in the poster. There is a link to the conference website, to references, and Tássio’s home page. Because there are clickable links, and the poster is viewed online, it’s not clear to me if there is any benefit to using a QR code in addition to a standard hyperlink to lead to references.

I would also like “References” to appear closer to the QR code so that it’s more obvious what the QR code is supposed to lead you to. The dot leader is meant to connect the two, but distance breaks the visual link between the two. There is an advantage of using dot leaders when you have lists with varying item widths. Maybe less useful for single items.

You can see more posters from this conference here.

More submissions from mathematicians would be most welcome!

05 January 2021

Better Posters book delayed again

Waiting area in airport
Due to everything that is going on in the world, not least of which is a global pandemic, the Better Posters book release has been delayed again. This time, the delay is probably not going to be as long. The target release date is now April.

April 2021, that is. I hope. 

The blogging binge is suspended until April. But I will say that I will have some nice posts for you then!

Workshops, parties, anything: Bring Better Posters to your campus

University of New Hampshire
Next month, hot on the heels of the release of the Better Posters book (available for pre-order now!), I will be giving a workshop at the University of New Hampshire.

I’m looking forward to this workshop, because several brave souls have said they are willing to send me their work in advance so we can look it over and actually work out how to improve it. It’s nice to have specific examples to look at so that people can see the process.

I not only wanted to say how much I am looking forward to talking to everyone at University of New Hampshire, I also wanted to say:

Book me!

I am available to talk to your students! I am available to talk on your podcast! I will answer interview questions that are emailed to me!

BetterPosters@gmail.com

External links 

Research Communications Academy: Communicating Visually: Making Your Posters and Powerpoints Pop


04 January 2021

The loss of posters is a loss for science

Late last year, it became know that two of Charles Darwin’s notebooks are missing, presumed stolen.

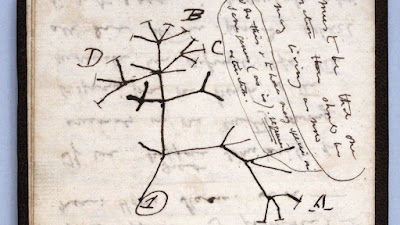
One contains what has become an iconic scientific image. It’s sometimes called the “I think” sketch, which is the first in all of Darwin’s writing to show branching relationships of organisms.

Sketch of phylogeny by Charles Darwin

It’s a critical piece in understanding Darwin’s thinking about his ideas of evolution. We rightly mourn the loss and hope they are one day found.

Darwin’s notebooks were meant to be for himself only. But now they are part of the history of science, and scholarship on Darwin is rich and nuanced because he kept things. We have notebooks. We have letters. We have so much more than his published books (which themselves are a substantial record of achievement).

And yet... this sort of wholesale loss of scientific knowledge has largely gone on, unnoticed, after every scientific conference, when presenters throw away posters.

Imagine how much richer future histories of science would be if historians would have the posters from poster sessions. I can’t help but wonder how much seminar, prize winning scientific works started out as just another poster in a poster session.

03 January 2021

Sunday scraps: Scale diagrams

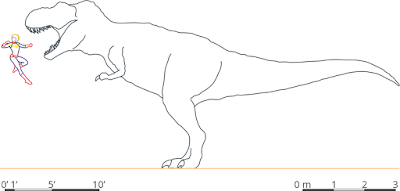
In the Better Posters book, I wanted to show the value of using a relatable objects for scale. Because it’s one thing to say “an animal was 4 meters long” and another thing to understand viscerally what that means. It usually means comparing that to something you interact with all the time.

I was inspired by the convention in paleontological drawings of showing reconstructions next to the silhouette of a human figure.(Can’t remember what artist pioneered that as a convention, although it has a long history.)

So I made these. First, showing that an ankylosaur was about the size of a compact car.


Scale drawing comparing a Mini Cooper, Captain Marvel, and ankylosaur


I created these images in 2019, which partly explains my use of Captain Marvel. I liked the idea of using a woman for scale, because too often male figures are the default.


Scale drawing comparing a Mini Cooper, Captain Marvel, and brachiosaur

I think I thought that a poor placid plant-eating brachiosaur didn’t deserved to be punched by a super hero, so I made this alternate.


Scale drawing comparing Captain Marvel and tyrannosaur

Unfortunately, all of these figure were nixed from the book. The site that provided the scale drawings, Dimensions.com, allows for their work on things like blogs but not for things like books.

I was pleased with these, because I thought dinosaurs and superheroes made the point in a fun way.

02 January 2021

Lessons from jigsaw puzzles

 For the holiday season, this showed up under the Christmas tree:

500 piece jigsaw puzzle, "Winter Friends," with wolf lying in snowy forest looking at red cardinal on tree

It’s going as well as can be expected.

Jigsaw puzzle pieces laid out on table

It occurred to me that puzzles have lessons for posters. Because puzzles tell us about how we make sense of images.

Here’s a slightly cleaner look at the image.

Wolf lying in snowy forest looking at red cardinal on tree

As soon as I saw the image on the box, I joked, “The bird will be the first thing done.” It was the only thing red, and I knew the bright red pieces would stand out in the box. And, as predicted, it was pretty much the first thing done.

Jogsaw puzzle pieces laid out on table

But it’s clear what else got done early on.

The classic way to solve a jigsaw is to start with the edges, because they have the only straight edges.

What do these things tell us? That we are good at detecting and paying attention to contrast. The bird is a contrasting colour. The edges have a contrasting shape.

The next thing that was done was the wolf’s face. This is probably because humans are very attuned to looking for faces. That the eyes are contrasting colours also help.

And after that, the legs got done. I searched for pieces with clear colour splits (that is, half white snow, half fur coloured).

And the moral of the story is: If you want people to pay attention to one particular part of a poster, us contrast – especially colour.


01 January 2021

The Better Posters advent calendar

This is the month.

If all goes well...

This is the month the Better Posters book should finally see the light of day! Publication is scheduled for 25 January 2021. So, just like last month, which has an advent calendar for an important date falling on the 25th,  I plan to count down the book release with a month of blogging! Takin’ it back to the roots, yo!

I’ll be blogging about lots of things. Some of my experience with graphic design before I started the blog, rejected content from the book, and some new material.

I am available for podcasts, workshops, and more! If you want to talk about the book, email me at BetterPosters@gmail.com.