One of the advantages of an online conference is that you can more readily measure what is working and what is not. Clicks, attendance, and visits are easily measured. Lucas Braun does some analysis of an online poster session:
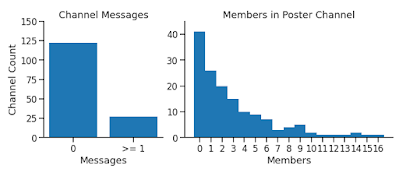
Poster session turnout at @cshlmeetings From Neuroscience to Artificially Intelligent Systems online conference (#NAISys on Twitter) seems to be bleak. Only ~18% of the dedicated slack channels had more than one message, and only ~55% had more than one external member. How can we do better online poster sessions?
It’s worth remembering that almost half of poster presenters in the long ago days of face-to-face conferences have given at least one poster where nobody talked to them.
I am hoping some organizers from other conferences would be willing to share their data!
• • • • •
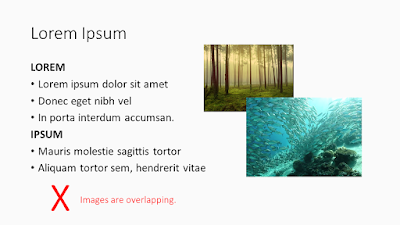
Amy Cheu has a free PowerPoint deck about designing presentations.
Lots of good reminders in a compact space!
• • • • •
The Society for Integrative and Comparative Biology, like many conferences, is going online for its next meeting. It has created a short “tip sheet” for its online posters here. The poster material is on page 2 of the PDF.
The examples they use are pretty good, although they all have too many damn boxes!
• • • • •
Everyone’s got a chart they want gone. Nick Desbarats says were probably should stop using slope charts. Graphs that look like this:
This take-home message applies to all graphs (emphasis in original):
(T)he risk isn’t that readers will miss out on important insights, it’s that they’ll get completely wrong insights, which is obviously a much bigger problem.
Hat tip to Boris Gorelick.
• • • • •
A poster presentation should be short. It should also be an opportunity for dialogue. I like this article by Mark Goulston about how to stop yourself from talking too much.
I think this paragraph might resonate with a few people in poster sessions:
One reason some people are long-winded is because they’re trying to impress their conversational counterpart with how smart they are, often because they don’t actually feel that way underneath. If this is the case for you, realize that continuing to talk will only cause the other person to be less impressed.
Hat tip to Viola Nawrocka.
• • • • •
Thoughtful Twitter thread about American election maps by César Hidalgo. He discusses that “visualizations are metaphors,” and he hits on a problem that has been bugging me about maps that try to minimize the “all or nothing” effect of by using purple:
Comparing shades of purple is nearly impossible.
Hat tip to Emily Rollinson.
• • • • •
To my surprise, César does not mention the election map from Le Monde, which won a lot of praise on Twitter.
• • • • •
And one more analysis of American election data by cartographers. There is much more than election maps, though:
The Washington Post tried making bar charts (showing the votes that have been counted so far) supplemented by a blurry zone to the right of the bar... Perhaps this “Fuzzy Bar” would be the famous viz to come out of this year?
• • • • •
I should really stop putting out every primer from MyFonts. But they’re so good. This one about using gray is no exception (PDF).
• • • • •
Three online courses for scientific illustration.
- Introduction to Organic 3D Modelling: 11-22 January 2021.
- Naturalistic and Scientific Illustration 1: Traditional Techniques: 25-29 January 2021.
- Naturalistic and Scientific Illustration 2: Digital techniques, 1-3 February 2021.
• • • • •
Acdamics are cheap and always resisting paying for professional graphics software. This answer on Quora examines the difference between Adobe Photoshop and its free alternative, GNU image processing.
Photoshop is a bit like an iceberg—what you see above the surface is only a small percentage of what’s there. You’ll find little symbols and hidden features in almost every Photoshop dialog that hide functionality most users don’t know about.
You can debate whether all that extra stuff is stuff you “need” as a poster maker for a conference. But at least be aware that the differences in the products are real.


1 comment:
Photoshop is a bit like an iceberg—what you see above the surface is only a small percentage of what’s there. You’ll find little symbols and hidden features in almost every Photoshop dialog that hide functionality most users don’t know about.
I don't doubt this for a moment — but it doesn't strike me as a difference between PhotoShop and GIMP. This is 100% my experience with GIMP.
Post a Comment