

Hat tip to Shit Academics Say.
Sometimes we have a best poster of the month, but this is probably the first nominee for best poster tube (click to enlarge):
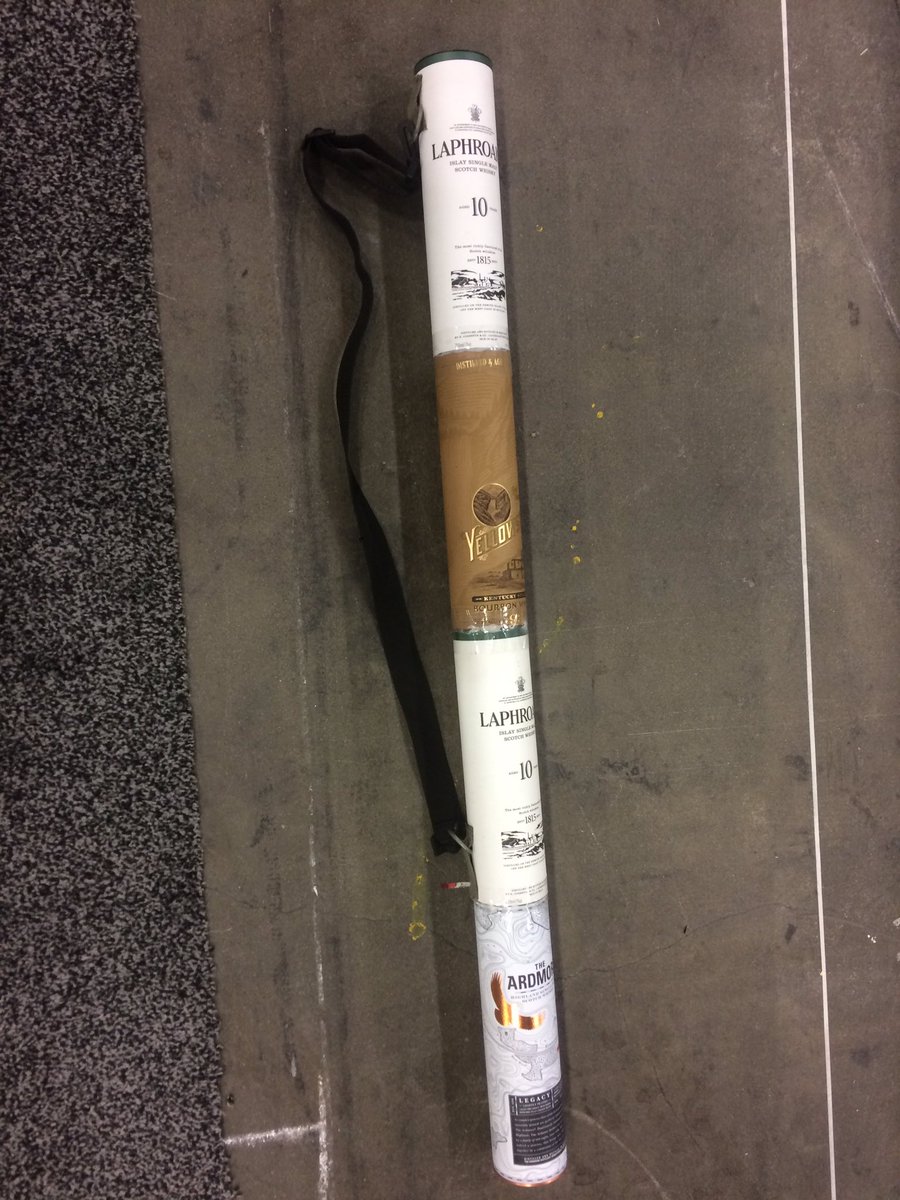
Hat tip to Ashley Cambell for discovering the whiskey tube scientist. From a geology meeting. Naturally.
Post of the month for December goes to Scott Cole, who analyzed the attendance at 2,579 posters at Neuroscience.

It is disappointing to learn 17% of posters had nobody at them. But if you ever have more than two people at your poster, you’re in the top half! Hat tip to Adam Calhoun.
Your title is the headline for your poster. This article looks at how headlines matter like never before, particularly online.
(E)ven with the best-crafted headline in the world, for every person who clicks on it, there are hundreds, if not thousands, who see it, digest it, and simply move on. People get their news from headlines now in a way they never did in the past, just because they see so many of those headlines on Twitter and Facebook.
People are used to getting news from headlines. Pay attention to your title. Your title is 90% of your poster.
Julie Lee has several poster viewing tips she learned from her first Neuroscience meeting.
Posters > Talks
I was repeatedly told this by SfN veterans and I’m glad I listened. The few talks I went to (that were directly incredibly relevant) were fairly useful but I definitely got more out of interacting with poster presenters. Also, for presenting, I would almost unreservedly give a poster for the longer interaction it offers with attendees (five minute Q&A vs. Four. Whole. Hours.).
- Keep your eyes open. Due to the aforementioned advice, I ended up getting more free time than anticipated, and was able to randomly wander around quite a few times. The most interesting things I saw at the conference were often not planned. A few times I ended up double-taking because the poster I just walked past was being presented by authors of papers I’ve used as inspiration for my work or read because they were doing very similar things. Additionally I ended up walking past some very interesting work that may not be relevant but were still cool to learn about.
- Budget for only a few posters per session. For me, 3-5 posters per session was the sweet spot for really getting the time to engage with posters (15-30 minutes each). However …
- Keep a back-up list. In case the posters are busy or withdrawn, or maybe turn out to be less interesting than you anticipated, save a list of 5-10 others of secondary interests or friends if you get the time (which I did, frequently).
- Priority label your itinerary. With the above said, it’s super useful (if you’re over-organised like me) to label your posters by priority (you can export your itinerary to google calendar!). Sounds like overkill but this gave me a quick way to see how many posters were essential per session and ration my time accordingly. Perhaps most importantly, it also let me (once) see which morning I could give a miss after a late night..
Head scratch of the month goes to Magda Havas, who convinced editors to use this figure as a graphic abstract to a journal article:

Hat tip to Neuroskeptic.
In the last few weeks, “fake news” has been the topic of much discussion. Part of the issue is that design decisions are taken away:
Over centuries, print media developed a visual language of credibility that became second nature to most readers: crisp type and clean, uninterrupted columns communicate integrity, while exaggerated images, messy layouts, and goofy text inspire doubt. On a physical newsstand, it’s still easy to tell the National Enquirer from, say, The Atlantic Online, it’s becoming increasingly difficult to differentiate between the two. ...
Over the last several years, upscale publishers that don’t draw a large percentage of revenue from banner display advertising, like Medium and Vice News, have embraced an extreme minimalist style that features text and blank white space above all else — the better to differentiate themselves from the noise of fake news and chum boxes. This visual austerity is the new mark of an upscale publisher.
Yet questionable outlets are starting to adopt these very same aesthetics of reliability, albeit on a delay of several years. Sites like Civic Tribune and the satirical National Report look no worse than The Huffington Post or Drudge Report, which are seen as legitimate publishers, more or less. Some, like the semi-satirical Real News Right Now, have even echoed the clean, gridded layout and decisive typography of sites like Digg and the defunct Atlantic Wire, an aesthetic that once suggested value-added aggregation.
Hat tip to Ellen Lupton.
This segues nicely into a look at the importance of the low design of the Trump campaign hat. Designer Matt Ipcar is quoted:
It was easy for me, as a Brooklyn-born creative director, to describe the hat as bad design. But the hat was worn. It was simple, unisex, familiar, and practical during a summer of hot crowded rallies throughout the South. Design-wise, it was lazy and loud, but also deceptively brand-aware and unmistakably Trump—a brash and calculated brand extension for a house whose luxury properties are awash in Gotham, understated bling, and lots of white space.
Another thank you to Ellen Lupton.
Ann Emery shares six ideas for displaying quantitative data in a more visual way, including putting faces with quotes and icons with text. Hat tip to Katy Kennedy.
And that, my friends, is that for 2016. Here’s a picture that reflects what many of us think of 2016:


No comments:
Post a Comment