08 September 2022

Box plot makeover

This is a figure in a journal.

Box plot with four boxes, each a different colour. X axis categories are "Unwashed control, washed control, unwashed experimental, washed experimental."

This is simple data that is much harder to interpret than it needs to be.

At a glance, it looks like it’s showing one variable with four groups. But it isn’t. To get that, you have to read each of the four labels on the horizontal axis very carefully.

Then you realize that the graph is showing two variables. It’s a 2⨉2 experimental design. One variable is environment and one variable is washing.

To make the relevant comparisons, I have to keep checking the axis label, because there is no other clue as to which box pairs with any box.

Significant differences are shown by three lines with asterisks above them. But the differences can be summarized in one statement: “Third from the left is higher than all the others.”

Here’s a quick and dirty graph makeover. As is so often the case, problems are solved by making things simpler.

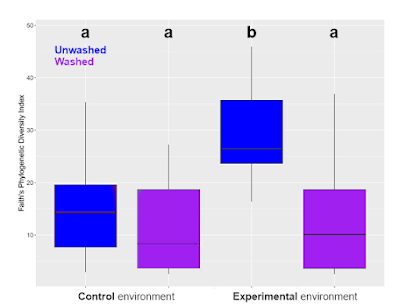
Box plot with 4 groups. X axis: "Control" under two left boxes, "experimental" under two right boxes. Blue boxes labeled unwashed, purple boxes labeled washed. All boxes have an "a" above them except the third from the left.

First, I reduced the axis labels from four to two, one for each “environment.” Fewer labels also means larger labels, both of which make the axis easier to read. It more clearly shows what the adjacent boxes are comparing.

Second, I reduced the number of colours from four to two, one for each “wash” condition. This more clearly shows which non-adjacent boxes should be compared. (The colour and legend could be better. Remember, this is a quick makeover.)

Third, I swapped the lines for letters. The rule is, “groups with the same letter don’t differ.” This does lose a little information. The original has some comparisons with three asterisks, some with two, which usually indicates different p values. But that level of detail can be put in the text if it’s that important. It usually is not.

(Aside: The graphing program OriginLab has “paired comparisons” as a built in option.)

The design principles at play in this makeover? 

First, be cautious of templates. The original graph looks like someone just used the default settings in a graphing program. (R studio, maybe ggplot2?) 

Second, simplify. 

Third, make related things similar. Usually, I say, “Keep related things together”, referring to similar positions in space. That is in play here with the axis labels. But related things are also shown by other similarities: colour, shape, and so on.

External links

Original Twitter thread

01 September 2022

One class of pharmacy students preferred online poster sessions

We spent two years mostly having conferences online. Many people see advantages to that format and want conferences to keep online options. But would online conferences be just a better-than-nothing kludge for people who would normally be left out? A roughly equal experience to traditional conferences? Or could it be that the online experience is actually superior to face-to-face presentations?

These questions matter more for poster sessions than oral presentations. Oral presentations online are a reasonably solved problems. TED talks have shown for years that a good recorded presentation can have impact.

A new paper compared students’ preference for online and face-to-face poster sessions. Axon and Whaley (2022) found people liked online poster sessions more.

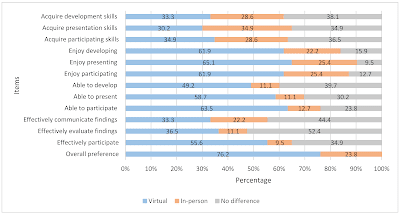
If the graph below, the blue on the left shows people who preferred online, the tan in the middle shows people who preferred face-to face, and the purple on the right is no difference. Click to enlarge!

Student pharmacists’ preferences for a virtual versus in-person research poster session. Figure legend: Acquire development skills: I would acquire more poster development skills if the research poster session is. Acquire presentation skills: I would acquire more poster presentation skills if the research poster session is. Acquire participating skills: I would acquire more skills participating in the poster session if the research poster session is. Enjoy developing: I would most enjoy developing a research poster if the research poster session is. Enjoy presenting: I would most enjoy presenting a research poster if the research poster session is. Enjoy participating: I would most enjoy participating in a research poster session if the research poster session is. Able to develop: I would be most able to develop a research poster if the research poster session is. Able to present: I would be most able present a research poster if the research poster session is. Able to participate: I would be most able to participate in a research poster session if the research poster session is. Effectively communicate findings: The most effective way to communicate findings from a research project is. Effectively evaluate findings: The most effective way to critically evaluate findings from a research project is. Effectively participate: The most effective way to help ensure everyone has the opportunity to participate in the research project poster session is. Overall preference: Overall, if I had to choose one approach for developing a research poster, presenting a research poster, and participating in a research poster session, I would choose.

More people preferred online over face-to-face in every category except one. People thought they had more ability to acquire presentation skills in a face-to-face setting (second bar from top). But even there, the advantage is not huge.

But there are many issues that need to be pointed out here!

This paper is the result of surveying one class of pharmacy graduate students. And I don’t mean, “a single course that has been taught multiple times,” I mean one group of students in one semester. The sample size is 63.

Critically, those students did not have experience with both formats in their class. They had to give their posters for their class in an online format. This is a “How would you know you liked it if you never tried it?” situation. Maybe some students had experience with face-to-face poster sessions before they took this class, but the survey didn’t ask.

It’s unclear what the online poster session for these students was like. This is the whole description:

The virtual format required students to record a presentation of their poster and provide a link for their peers to review and comment on during the research poster session.

Online poster presentation platforms vary wildly. Some are good, some are not so good. Maybe the team teaching this course managed their online poster session extremely well, and that was reflected in students’ responses. Opinions don’t exist in a vacuum.

It’s great that people are open to the possibilities of online poster sessions. But this paper tells us little about whether people who have experience with both formats prefer. And that seems like an important question to ask.

References

Axon DR, Whaley M. 2022. Student pharmacists' perspectives of in-person versus virtual research poster presentations. Pharmacy 10(5): 104. https://www.mdpi.com/2226-4787/10/5/104