The AGU presentations fall into three categories. People can be invited to give a talk (“Invited” in the graph below). Researchers can submit abstracts, and session organizers decide whether it is a talk or poster (“Assigned” in the graph below). Or people can just decide to give a poster.
They found a strong and consistent pattern: under-represented groups were consistently giving more posters than other groups.
(S)cientists from under-represented racial and ethnic minority groups had the smallest chances of being selected and invited to speak, and opted for poster presentations more often than did their peers. ...
We did not investigate why URM geoscientists applied to give only a poster more often than did others overall, and at every career stage. There could be several reasons. People might be held back by psychological factors such as lower self-confidence. ... Or, some URM scientists might value poster presentations — this format could align with different goals, interests or lived experiences, for example by enabling researchers to communicate findings in one-on-one conversations.
I greatly appreciate that the authors mentioned that people might want to give posters! (See below.) But even I, a big advocate of poster sessions, know that most people consider talks more prestigious than posters. I personally think this should not be the case, but there it is.
The imbalance in the other categories can’t be easily explained by presenters’ personal choices, however. They are strong indicators of biases in conference organization that should be addressed.
Hat tip to Cailin Gallinger.
I missed this blog post from May about why poster sessions are the best part of conferences.
During the lecture session, attendees learn from the speakers, but since question time is almost limited, it is unclear what to do with unanswered questions. This is where the poster sessions come into play as a solution to this problem. Usually the lecturer is the lab head and lab members present posters. We can ask them in detail without time limit as long as the post presenter is happy and patient enough with us.
The notion of what to wear in an academic setting (including poster sessions) is a fraught one for many women, as by the reaction to Dr. Emma Beckett’s dress.
The Sydney Morning Herald has an excellent summary of the discussion raised by the “vegetable dress” here.
This journal article by Sousa and Clarke reinforces many points on this blog. Their six main points:
- Don’t copy most other posters
- Nail your key messages
- Hone your messages and context for the audience
- Conceptualize your poster design
- Create your poster, then get feedback
- Learn from every other poster
Andreas Müller won the award for “Best teaching project” poster at the MAXQDA International Conference. Click to enlarge!
Andreas helpfully has a substantial blog post describing some of the considerations that went into making his poster. For example:
No one will read your poster from beginning to end. No one. If we have accepted this fact, our posters will become much better.
Some headings from the post:
- “Don’t put too much text on your poster!”
- Create several points of entrance
- Use questions as headlines
- Posters are a chance to connect
- Give your poster a digital afterlife
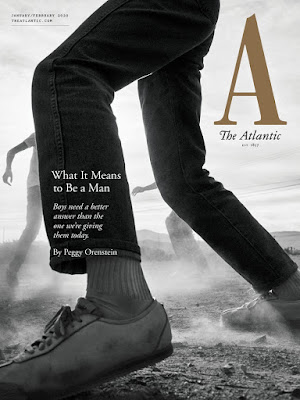
The Atlantic magazine recently underwent a redesign.
The Atlantic’s design team turned to the magazine’s history for inspiration. The result is what feels like a deliberate step back from the norm of web-conscious print design, into an old-school aesthetic whose gravitas is buttressed by a print legacy of over 160 years.
It’s interesting to compare this redesign to the one Nature did recently, which I mentioned back in October. Both include completely custom typefaces, for example.
I love Amy Tabb’s notion that a conference is “scientific camping.” How to pack for a conference.
One of the items on James Heathers’ list of things that help make a conference great:
- local poster printing
This is a good point. Some conferences are in places with “business centers,” but large format printing is a little bit specialized and not available everywhere. Conference organizers would do well to try to find if emergency poster printing is available nearby.
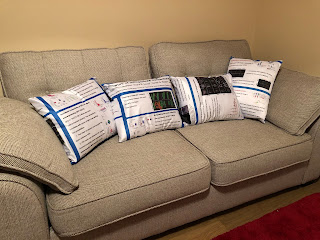
I always love sharing fabric poster arts and crafts.
This fine example from Steve Royle.
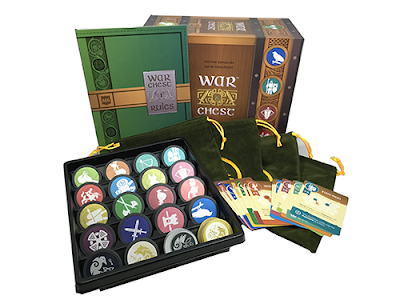
Johannes Wirges argues that board games teach you how to visualize data.
Board games tend to use easily readable encodings of data. Categorical data is usually encoded via color hue and shape. This goes, for example, for the different kinds of meeples controlled by each player. Numerical data is usually encoded via location among common axis, number of elements, and size of elements. Board games seldom include more difficult to discern encodings like shades of a color hue (light to dark) or orientation.
I will end with this from Spider Robinson:
The whole world turns upside down in ten years, but you turn upside down with it, so to you it’s right side up.
The world turned upside down for me, and it’s only with effort that I can realize it did.
This is the last post of... the decade. When the decade started, this blog had been in play for less than a year. Now, going into 2020, a book based on the knowledge I’ve gained in 10 years of blogging is completed and will be out at the start of next year.
Having a book coming out next year is both wonderful and nerve-wracking. I am looking forward to you having the chance to read it sometime in the next decade.


