31 August 2022

“Design a poster” interview with Tullio Rossi

Friends of the blog Tullio Rossi and Echo Rivera (who penned the intro to Better Posters) talk posters!

This should have been in the last month’s link round-up. Whoops. But I don’t want to wait several weeks to get it into the next one, so it gets a stand alone post!

25 August 2022

Link roundup for August 2022

There’s a lot of device on making graphs, but sometimes research on whether the advice works is harder to come by.

This research paper on graph design tries to assess whether “decluttering” (Edward Tufte’s “data to ink ratio”) and “focus,” which is annotation of graphs. I have to say “try” because the sample size for the experiment is just 24 people, which seems small for a topic like this.

Dot plot showing ratings for the three visualization design on a scale from 1 to 5 on aesthetics, clarity, professionalism, and trustworthiness. Focused graphics rates highest in all four categories.

“Focusing” on a graph was very effective in helping people remember. 

Removing clutter had a smaller effect, but people generally liked those graphs a little better.

Ajani K, Lee E, Xiong C, Nussbaumer Knaflic C, Kemper W, & Franconeri S. Declutter and focus: Empirically evaluating design guidelines for effective data communication. IEEE Transactions on Visualization and Computer Graphics: in press. https://doi.org/10.1109/TVCG.2021.3068337

This is a plain English summary of the paper

• • • • •

People like to attack graphs with a lot of noise in this. Stuart Ritchie reminds us, “Noise is why we use statistics

 And that’s it for this month!

18 August 2022

Review: Storytelling with Data

Cover to book "Storytelling With Data"

Some scientists might pass over Storytelling With Data (2015) because they have an incredible aversion to the word “storytelling.” Author Cole Nussbaumer Knaflic might drive off some people when she writes things like, “The magic of story.” It can sound a little hippy dippy trippy sometimes.

If “story” and “storytelling” freak you out, let me make a pitch for this book and give you another way to look at it.

Most of the book is about annotated data visualization. Fully seven of the book’s ten chapters are devoted to picking apart and recreating graphs. 

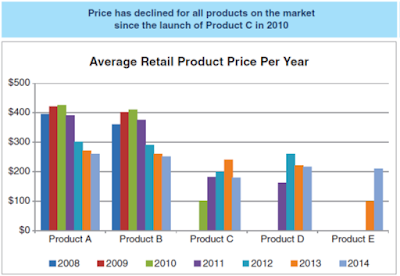
For example, Knaflic takes a mundane bar graph like this:

Bar graph of annual retail prices per year.

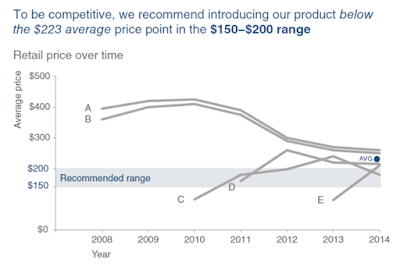
And shows the process to get to this:

Annotated line graph of annual retail prices per year.

Same data set. But one has a much clearer focus on what information is critical to the viewer.

I sometimes do similar things with graphs here on the blog, and some of the principles will be familiar to readers of the Better Posters book. But this book drills down into making a single graph in a much deeper way, with many more examples.

How to take a single graph from an Excel default and into something more targeted and informative has been on my mind a lot lately, and this book is the best I have found on the subject so far. Recommended.

Related posts

Same graph, different narratives

External links 

Storytelling with Data website

16 August 2022

Conference presentation accessibility

SurveyMonkey logo
I am helping with a project on conference accessibility. I was brought on board because of my interest in posters, but this research is about oral presentations, too.

To get us started on data collection, we have a short (~10 minute) survey on how presentation format impacts people with accessibility needs at academic conferences.

You can take the conference presentation accessibility survey here: https://www.surveymonkey.com/r/2DNJ2NX

Or you can use this easier to remember shortened link: https://bit.ly/ConfTalkAccess (Short for “Conference Talk Accessibility.”)
 
Or you can scan this QR code:

QR code leading to conference accessibility survey

This survey will be available through 6 September 2022.
 
Please take the survey. Please share the survey with others who might go to conferences. Thank you for your support! 😁

11 August 2022

Expectations and visual noise: Lessons from washing machines

“How do I turn this on?”

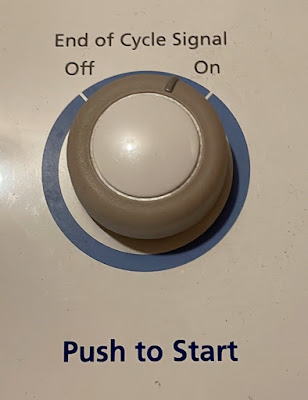
I was visiting, trying to use the washing machine, and was confronted with this.

Washing machine button with instructions in fine print at the bottom.

When you want to turn on something with a knob, you look for something around the dial that “Start” or “On,” right? Nope.

But maybe this was more a button, and when you want to turn on something with a button, you press it, right? Nope.

I couldn’t get the washer to start. I literally gave up on fiddling with the machine. Instead, I:

  1. Opened my phone
  2. Typed in the maker and model of the washing machine
  3. Found an owner’s manual online
  4. Downloaded the PDF of the manual
  5. Skimmed through the first few pages until I found the instructions to turn on the machine.

No joke. And I did all this even though the answer was staring me in the face.

If you look at the button above, you will see the instructions to turn it on. And there’s the first problem.

“Pull start.”

You mean, the complete 180° opposite of the usual thing that people do to turn on machines? Maybe something that runs so counter the norm is important!

Lesson #1: Warn people – loudly – if something works differently than the way most other things work, warn people. Not in a whisper.

But even putting that aside, why could I not see the instructions that were helpfully right by the button? There’s the second problem. The instructions are in fine print, surrounded by a lot of other information about four other wash cycles, at the bottom.

Lesson #2: More information can make a task harder, not easier.

This washer button reminded me of so many conference posters I have seen over the years. Things are not in places readers expect them to be. There is so much information and so little emphasis that readers are struggling to find what they want.

My case was unusual, because I was using this machine for the first time. You do expect the same person to be using a home appliance over and over again. The “fine print” instructions are normally only going to serve as a reminder.

But I had no problem turning on the dryer.

Dryer buttom with ““Push to start” in large bold letters.

Less information, and what is present gets some emphasis using size, bolding, and colour.

This is more like what a conference poster should aspire to be.

Drake turning away from hard to use washer button and approving of easy to use dryer button.

A shorter version of this originally appeared as a Twitter thread.

04 August 2022

Remove one thing: Lessons from Chanel

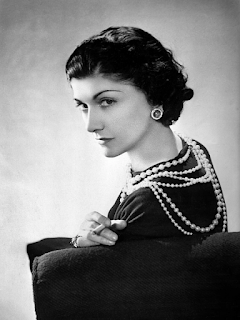
Coco Chanel
Coco Chanel is to fashion what Albert Einstein is to science: a lot of stuff gets attributed to these people that they never said.

This quote is often attributed to Chanel:

Before you leave the house, look in the mirror and remove one accessory.

Nobody seems to be able to point to an original source where she said this, which is the usual sign that the quote has somehow attached itself to a person because of their fame. 

“Too much stuff” is probably the most common problem plaguing posters and poster sessions. I am always trying to find ways to help people simplify their posters.

What I like about applying the advice attributed to Chanel is that it turns what can seem an overwhelming task – cutting down to the absolute bare bones, throwing out the cluuter – into a manageable task.

Take out one thing. Just one. That’s not so hard, is it? Surely you can find one thing on your poster you can do without.

I would write more about the application of the “Chanel rule,” but Alec Nevala-Lee beat me to it. He wrote:

What makes the Chanel rule so powerful is that when you glance in the mirror on your way out the door, what catches your eye first is likely to be the largest, flashiest, or most obvious component, which often adds the most by its subtraction. It’s the accessory that explains too much, or draws attention to itself, rather than complementing the whole(.)

The poster version might be:

Before you print your poster, look it over and remove one thing.

External links

The Coco Chanel rule