27 August 2020

Link round-up for August 2020

Modesta Abugu and Caroline Dowling have a nice article describing their experiences with online poster sessions at the Plant Biology 2020 conference.
 
PlantBio20 online poster session
 
 Their messages:

  1. Take it seriously. It’s easier than ever for people to spot errors.
  2. Promote it!
  3. Align your poster with other content you upload.
  4. Be ready for questions.
  5. Don’t be discouraged!

I keep asking for other people to talk about their experiences with virtual poster sessions, and this is the most I’ve seen so far. Please, if you have done an online poster session, email or tweet me about it!

• • • • •

Speaking of the Plant Biology meeting, there is now an archive of the workshop on illustrations. (Warning: Contains me.) 

All the speakers went through the chat transcript and added many more comments to the questions, many of which we could not answer live during the session. So even if you were in the workshop (and thank you if you were!), this may be worth visiting!

• • • • •

Animate Your Science have turned their blog post on poster design into a free PDF (17 pages), which is a little more portable and polished than the original blog post. (Update, 1 October 2020: Link to PDF updated.)

Cover to "How to Design an Award-Winning Conference Poster"

You do have to give up your email address to get it.

Animate Your Science also wrote a guest post over on Echo Rivera’s blog.

• • • • •

Academic conferences have changed this year. This article by Rafit Ali argues that even if COVID-19 fears goes away, the dominoes have started to topple, and the event industry will never be the same. 
 
"Then" over Napster logo. "Now" over Zoom logo.
 
Zoom is the Napster of the event industry, the ease with which you can put on good-enough virtual events with a global audience, almost for free, much to the undercutting of the underlying economics of the physical events world. All types of business event — conferences, trade shows, conventions — are in danger of their revenues streams of tickets, sponsorships, memberships, and other types of fees being eroded as the world gets used to digital formats and alternatives emerge to physical networking, matchmaking and other tasks we get out of these events.

Perhaps the most worrisome prediction is that by moving conferences online, “analog dollars become digital pennies.” Many scientific societies make much of their income through their conferences. The financial stresses on existing societies could be huge.

(I was a little surprised to see RELX, the parent company for the academic publisher Elsevier, listed as one of the biggest players in the event industry.)
 
• • • • • 
 
Jessie Baldwin tweeted:

I have been told that my study (currently under review as a Registered Report) isn’t eligible to be submitted for a conference presentation because the results are not known. Apparently the results are essential for the paper to be evaluated. This isn’t how science should work!

That’s... new. Incredibly unexpected and definitely counterproductive. But new. Rank and file conference presentations should not be vetted to this level of detail. People should be able to show incomplete or preliminary projects.

• • • • •

Calibri is a fine typeface that people are sick of because it is overused because it is the default in Microsoft Office. It used to be Times New Roman. A Microsoft team member explains why the default was changed.

Mobile phones were a big part of the switch.
 
• • • • •
 
Typography against fascism. The largely unknown politics of the Futura typeface.

• • • • •

The new logo for Iceland’s soccer team is quite something.

Iceland soccer logo, composed of four part: eagle, giant, bull, and dragon.

The abstract logo is kind of like those giant Japanes robots that combine to form one big robot. It has four parts that work individually: eagle, giant, bull, and dragon. But they are also combined into a single image.

• • • • •

Typography nerdery meets SF nerdry. The typography of Star Trek: The Motion Picture (with notes and comparisons to classic series, and newer movies, too!).

USS Enterprise saucer

My love for sans serif fonts like Microgramma trace straight back to this.

This post is an extract from the book, Typeset in the Future.

• • • • •

Nature reports that most acronyms never make it into wide use. Stop making new ones. And especially don’t make up ones for a poster!

• • • • • 

Speaking of Nature, remember how they redesigned their journal a while ago, including a custom typeface? The Atlantic did it, too. In June, Goldman Sachs became one of the first businesses I know to develop their own custom typeface: Goldman Sans (+1 typographic pun there, people).

Numbers in spreadsheet typeset in Goldman Sans

 There’s a New York Times article about it, too, with some fun jabs at the font from other type designers and good analysis.

This dual life is a lot to ask from a font: distinctive enough to please aesthetes, neutral enough to include in paperwork for an initial public offering.

You can download the font file (six roman weights, three italic weights, and two condensed weights) here. Hat tip to Geetesh Bajaj and Ellen Lupton.

• • • • •

In July, I reviewed a few online graphics editors like Vectr, Canva, and DesignCap. Another service in that space is Piktochart

Piktochart logo

The user interface and features look very much like Canva and DesignCap. Like DesignCap, paper size is a potential dealbreaker. 40 inches wide and 52 inches tall are the maximums.

Hat tip to Sydelle de Souza.

24 August 2020

The Word Lab Session on poster design

This week!

"10 Simple Rules for Designing an Academic Poster" Sydelle de Souza, 26.08.2020, at 1430 (UTC+1)

WordLab presents “10 simples rules for designing an academic poster.” with Sydelle de Souza. It’s free to attend this Zoom meeting, but you do need to sign up here to get an invite and the link to the meeting. Scroll down, and you’ll find it on the left-hand side.

Word Lab Sessions is an online place for casual conversation about linguistics in academia. I stumbled across their upcoming session on Instagram and though it would be of interest for some readers, particularly for any of you who are in Europe or Africa. (The time differences make it an early morning for someone in western North America!)

This is just one of several sessions they have hosted. Another general topic coming up is “The Fundamentals of Writing an Academic Paper” on September 16. (It‘s good to know even linguists have to work at this.) Most of their session focus on linguistics, so if linguistics is your main wheelhouse, definitely check them out!

External links 

The Word Lab Sessions

20 August 2020

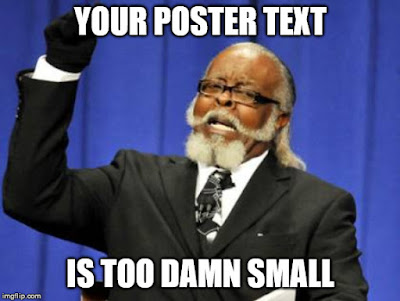
Your poster text is too damn small!

One of the most frequent questions I get when I talk about posters is, “What’s a minimum point size?” I got it a few weeks ago when I was speaking at the Plant Biology meeting. If you’re a regular reader of this blog, you might guess that it’s hard to answer this question. But in general:

Your poster text is too damn small

Your poster text is too damn small.

One place we can look for guidance for text size is the Americans with Disabilities Act (ADA). This year marks the thirtieth anniversary of the act, which was a big win for people with disabilities in the United States. The ADA has a lot of specifications intended to maximize accessibility for people, including people with visual limitations.

Not surprisingly, the ADA does not offer guidance for academic conference posters. But it does offer guidance for signs. Signs are probably a pretty good parallel for conference posters. Both need to be visible from a distance and easily read, even for someone with less than perfect vision.

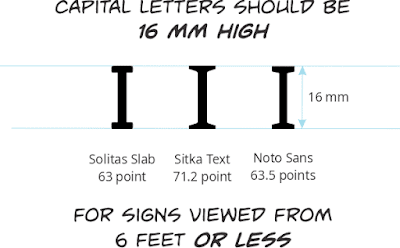
Rather than using point size, the ADA makes recommendations based on the height of capital letters; the uppercase letter “I” if you want to be specific.

Capital letters should be 16 mm high for signs viewed from 6 feet or less

The ADA requires that the capital “I” on signs be 16 mm tall if you are viewing from six feet or less. That is the usual kind of range people are viewing conference posters. That’s usually in the ballpark of a 66 point font. Point size is not a precise thing in digital fonts, so you have to double check the exact point size.

If you are viewing from further away (as someone might be when reading your poster title, say), the required minimum size goes up. For ten feet, that recommend height of capital letters is 28.8 mm, which is around 120 points.

Those ADA requirements for signage asks for text that is much larger than I usually see when people talk about “minimum point sizes.” I usually see recommendations like, “No smaller than 24 points” (that was AGU’s recommendation last year for body text, for instance) – less than half the ADA standard.

Of course, the ADA is not the only guidelines out there for making visual material accessible to many people. I’m sure other nations have developed their own standard for accessibility.

Nor I am not saying your academic conference poster needs to be ADA compliant. But I think this is a good example of a mismatch between the concern of many academics, which is “Show as much stuff as I can” and the concerns of people thinking about accessibility, which is, “Make is visible to as many people as I can.”

When face-to-face poster sessions return, consider it a challenge to make your poster ADA compliant!

13 August 2020

Posters with plans get as much feedback as posters with results

“Prereg posters” was an idea floated a couple of years ago (and nobody told me about it!) (Tibon et al. 2018). The idea is to present planned work on a poster, before data are collected, to solicit feedback.

Recently, a new paper came out (Brouwers et al. 2020) showing that these prereg poster work pretty well. The prereg posters with no data (or maybe very preliminary) seemed to get as much feedback and as much foot traffic as posters with data.

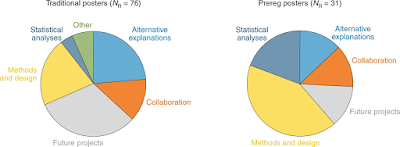
The kind of feedback people got differed, though, with prereg posters getting more attention to the methods and stats discussed, as shown in the figure below (click to enlarge).


Distribution of responses to the post-conference survey question, “what kind of feedback did you receive?” among presenters of prereg posters (left) and traditional posters (right). NR represents the total number of responses.

One question that wasn’t asked of poster presenters was, “How valuable did you find the feedback you received?” It would have been nice to try to asses whether the feedback was as valuable in addition to how much people got.

I think this is an important finding for people making posters in general. The abstract submission deadline is often so far in the future that people haven’t completed data collection and they don’t know what they will have when the conference rolls around. This can be reason for people to stress out. This paper suggests that that’s okay. People will still come and talk to you!

References

Brouwers K, Cooke A, Chambers CD, Henson R, Tibon R. 2020. Evidence for prereg posters as a platform for preregistration. Nature Human Behaviour. https://doi.org/10.1038/s41562-020-0868-z

Tibon R, Open Science Committee CBU, Henson R. 2018. Title TBA: Revising the abstract submission process. Trends in Cognitive Sciences 22(4): 271-274. https://doi.org/10.1016/j.tics.2018.01.008

06 August 2020

Mystery whiskers: deciphering box plots

Last week was the first Animal Behavior Society virtual meeting. I watched a lot of presentations (which I wrote about over at NeuroDojo: Day 1, Day 2, Day 3, Day 4).

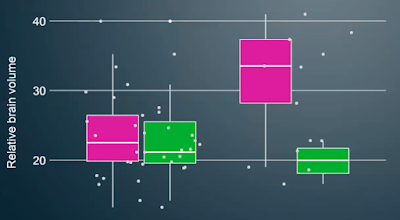
A lot of presentations showed data in box plots, like this:

Box plot

I’m having a hard time understanding this graph.

This plot shows both the box plot and what I assume is raw data overlaid on top. But the raw data are so scattered in the horizontal, it’s hard to figure out which data points are supposed to be associated with which boxes.

But putting that aside, I’m wondering what people think the plot shows. Because none of the components are labelled.

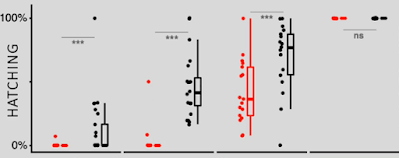
Here’s another example.

Box plot.

Nothing labelled here, either.

In looking at posters over the years, I have noted that one of the most common problems is that people show something like a bar graph of averages, and show error bars, but nowhere on the poster does it say what the error bars show. Even when I ask, presenters often turn back to the graph to look at it and make a face while trying to remember. They often can’t remember.

The whole advantage of box plots is supposed to be that they provide a more detailed view of the data than a simple average. But you don’t tell me what any of the components in the plot are, then there is no advantage.

That I kept seeing box plots with no description, nothing, made me curious: what do people think are being shown by those whiskers?  (I asked on Twitter, too; most replies here.) Obviously, the person making the graph thought it must be clear. They probably think there is an “industry standard” for box plots, but there is not.

And you can’t just assume that everyone draws box plots the same way you do! Wikipedia notes:
 
(W)hiskers can represent several possible alternative values, among them:

  • The minimum and maximum of all of the data
  • One standard deviation above and below the mean of the data
  • The 9th percentile and the 91st percentile
  • The 2nd percentile and the 98th percentile.

Any data not included between the whiskers should be plotted as an outlier with a dot, small circle, or star, but occasionally this is not done.

Some box plots include an additional character to represent the mean of the data.

On some box plots a crosshatch is placed on each whisker, before the end of the whisker.

Rarely, box plots can be presented with no whiskers at all.

I suspect this is another case of computers making it too easy to draw the wrong thing, as Dan Roam says. People just use the default box plot their graphic software creates and don’t critically examine the output.

I’m just surprised it’s a problem for box plots, since I would maybe expect that if you’re interested enough in showing variation in the data, you’d think about what people need to interpret the variation.

I am not sure what the best solution here is, There are several.

  1. Ask if you can replace the box plot with a bar graph, and put “SD” or “SE” or whatever in the Y axis label. Bar graphs cop way too much abuse. (Remember, the context is posters here, not journal articles.)
  2. Put the description in fine print under the graph. This is the simplest to achieve.
  3. Make a legend for the plot. (Origin 2020 does this automatically, so this can be fairly easy in some cases.)
  4. Label the elements on the graph the first time you show a box plot. This may be the most clear for a viewer, but is probably the most work for the presenter.
 
The last two options both have the advantage of putting information at the point of need, on the graph itself.

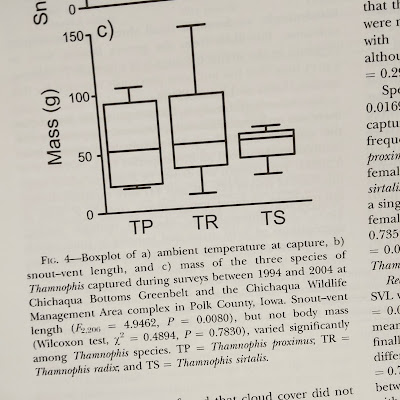
Update, 7 August 2020: I was surprised that the day after I post this, I pick up a journal from my mailbox, flip it open, and spot a box plot. 

Box plot with legend that describes none of the part of the plot
The figure legend contains no help whatsoever in deciphering the plots! There is no way to tell what anything means. All I can tell is that the averages are kind of around 50, and most of the data are somewhere between 25 and 150? It’s not useless, but it certainly could be more useful.