Alex Flores recommended this video on every NFL score ever. It’s good that he recommended it, because as a huge anti-fan of American football, I never would have stumbled across it myself.
If you don’t want to watch the video, you can get a sense of what it’s about in written form here.
What this does a good job of pointing out is the utter numerical weirdness of American football. Whereas most games have single points, American football doesn’t. Which means scores are strangely distributed. And this makes for some interesting statistical exercises.
And this got me thinking about how sports graphics could be a useful source of inspiration for posters. Different games have develop different representations of play. For example, here’s a live score (or “score worm” from an Australian rules football game:
Tennis serve placements show a fairly simple spatial representation.
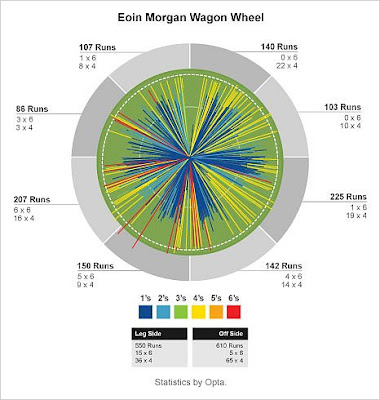
Cricket has “wagon wheels.”
It wouldn’t surprise me if sports stats graphics are often better than scientific graphics, because there is money in sports. People wouldn’t bat an eye over hiring someone just to do graphics. And the types of stats for a given sport get sort of standardized (RBIs in baseball, kicking accuracy in AFL, run rate in cricket).
Now I want to interview someone who does these sorts of thing professionally.
External links
Chart Part: Scorigami, or the story of every NFL final score that has ever happened


No comments:
Post a Comment
Comments are moderated. Real names and pseudonyms are welcome. Anonymous comments are not and will be removed.