If I hadn’t written a book on poster design, Building Science Graphics might be the book I would recommend to people who wanted help creating posters.
The book is not about posters, no. It’s not about data visualization, either. Jen Christiansen calls the work that she is writing about “illustrated explanatory graphics.” But I am interested in this book because it points the way forward for how a lot more posters could be.
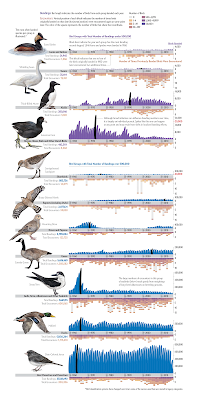
The default format for most conference posters is a three column mini journal article in IMRAD format. There are advantages to this format, but it is both limited and limiting. I would like more people to consider making their posters like this “illustrated explanatory graphic” from Scientific American, where Chistiansen works. Click to enlarge!
This is the sort of visual that I think would absolutely rock as a conference poster. It’s immediately obvious what it’s about (birds), but has dense, detailed data that wouldn’t be easy to convey as a series of slides.
With this book, I can get to see how those sorts of print illustrations are created. Christiansen noted on Twitter this this graphic was the combined work of three people, excluding herself. (This is in stark contrast to many posters, which might be largely the responsibility of a single grad student.)
If you look at an illustration like that and think, “But I can’t draw realistic birds like that,” the point is not how realistic the birds are. Sure, they add a professional gloss to it, but probably 80% of the effectiveness of the graphic is the understanding and presentation of the content. You could use bird silhouettes from Phylopic or something, and you could still have a winner.
One of the concepts introduced in the book early on is a phrase that I know I will use a lot when I’m discussing graphics: visual jargon.
It’s tempting to proclaim that visual languages are more universal than spoken and written languages, and that the very act of presenting information in the form of a drawing instead of words makes it more accessible. But that’s not necessarily the case. Visual jargon, for example, is just as prevalent as written jargon. Symbols that carry highly specific information within a certain context can be a really efficient way to communicate with others that are fluent in that visual language, like a peer group of scientists. But they are simultaneously a brick wall to outsiders.
“Visual jargon” is a perfect encapsulation of a pattern I notice a lot in scientific graphics. Box plots, raincloud plots, and violin plots are all visual jargon. Protein structure diagrams with ribbons and spirals are visual jargon. Phylogenetic trees are visual jargon. But while we recognize written jargon and there have been many justified critiques of it, visual jargon is often actively encouraged (“Friends don’t let friends make bar graphs”) without recognizing the costs that it brings.
Many chapters will be familiar to readers of this blog and book. The first several chapters, particularly 4 through 9, cover graphic design building blocks like use of contrast and typography. Even in these chapters, there are some insights that you don’t often see covered in other works. For example, her exploration of how to use arrows in illustrations (pages 66-67) is insightful and not something I’d seen elsewhere.
For those looking for something new, Chapters 10 (Visual style), 11 (Visual storytelling), and 13 (Special consideration) cover new territory. The tips and examples of how a graphic can become not just and explanation, but a story, are particularly insightful.
I have to highlight Chapter 7 (Organization and emphasis), because it ends on pages 90-95 with a section on conference posters! Christiansen presents three posters, and gives each a makeover, much like critiques I often do here on the blog. The first two are quite good examples of typical posters and the revisions are helpful and welcome. The third poster (the one with a butterfly) presented as needing a makeover is better than most posters I see! While the makeover is better, I think anyone who put up the first version would be crushing it compared to the competition.
The book ends with a series of “How to” chapters. Several are elaborate flowcharts that try to codify Christiansen’s decision tree and workflow. Chapter 18 (Collaborations) is also an important chapter, because too many people in science try to “go it alone” when creating graphics.
The book is full colour and has many examples throughout, with a lot drawn from Christiansen’s experience commissioning and developing graphics for Scientific American.
Clearly, Jen Christiansen is a person after my own heart. Not only graphically, either. She has crustaceans in her background! She even helped describe a new shrimp species.
Highly recommended.
Update, 28 November 2023: Jen has put up Chapter 3 for free on her website.
Reference
Christiansen J. 2022. Building Science Graphics: An Illustrated Guide to Communicating Science Through Diagrams and Visualizations. CRC Press: New York. https://doi.org/10.1201/9781003217817
External links
Building Science Graphics (The “More to explore” provides a useful and detailed bibliography)
What scientists have learned from 100 years of bird banding (graphic)
PolicyViz Podcast #235 Interview with Jen
Data Viz Today #85 Interview with Jen


No comments:
Post a Comment
Comments are moderated. Real names and pseudonyms are welcome. Anonymous comments are not and will be removed.